How to create a problem-solving flow chart
Problem-solving is one of those topics that we’ve often discussed on this site (check out our Problem Solving guide ). We think it’s one of THE vital skills of business. Why? Because you’ll come across problems every day, and you need to arm yourself with the right tools to solve them.
A problem-solving flowchart is one of those tools. It’ll help you take a problem statement, break the problem down into likely causes helping you get to the bottom of what’s gone wrong.
In this post, we’ll cover
- What is a Problem Solving Flow Chart
- How to create a Problem Solving flow chart
- Example 1 of Problem Solving flow chart
- Example 2 of Problem Solving Flow chart
- What flow chart shapes to use
- When should you use a flow chart
- 7 tips on creating your Problem Solving chart

Key Benefits & Likely issues with the tool
Let’s get started!
What is a Problem Solving Flowchart
A Problem Solving flow chart is a diagram that uses shapes, arrows, and text to show a moving sequence of actions and/or activities that help solve a problem.
How to create a Problem Solving flowchart
- Describe your problem.
- Pose Yes/No Questions that can help identify the cause of the problem
- Question each stage of the process until it is fully examined
- Repeat steps 2 & 3 until you have identified a solution
- Try the solution; if it is successful in addressing the root cause, then you’ve fixed your problem. If not, repeat the process until you have a solution that works.
A problem-solving flowchart attempts to identify a root cause/solution to the trigger that is causing the problem allowing you to change the process and prevent the problem from occurring.
Let’s now demonstrate the effectiveness of a problem solving flowchart by showing some examples.
Example 1 Problem solving flow chart
In our first example, we’re going to start with something simple to show you the principle of the tool.
We have been given a cup of tea and we don’t like it!
Let’s use a problem-solving flow chart to find out what’s gone wrong.
We’ve used Excel to capture this flow chart using flowchart shapes (insert –> shapes), you can, of course, use other applications to do this, you don’t’ have to have specialized flow chart software to do this. ( there’s a great flowchart in Excel video here ). Or you can simply use a pen and paper.
Use a rectangle and add your problem statement.
Remember to keep your problem statement unambiguous and straightforward. Here we’ve used “I don’t like my cup of tea.”
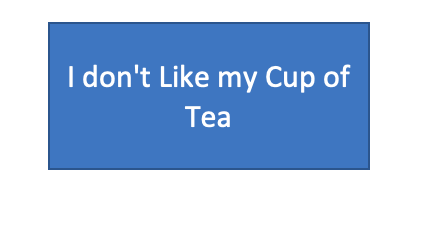
Now that we’ve got our problem statement, we’re going to start asking questions.
We’re going to examine the variables that go into a cup of tea in an attempt to find out what’s gone wrong.
** TIP** – Work through your process – rather than start from scratch, if you have a documented process, work through that examining each step to ascertain if there are issues. If not, you might find it useful to research and sketch out the process before starting with your flowchart.
We have a process for the cup of tea, which is:
1/ Boil Water
2/ Place Breakfast Tea teabag in the cup
3/ Add Water
4/ Leave to sit for 2 mins
4/ Remove teabag
5/ Add milk
6/ Add sugar
So our problem solving flow chart needs to examine each of those steps to determine where the failure has occurred.
We’ll add a question shape (diamond), connect out problem statement to it using an arrow to check if we boiled the kettle. Our Diagram will now look like:
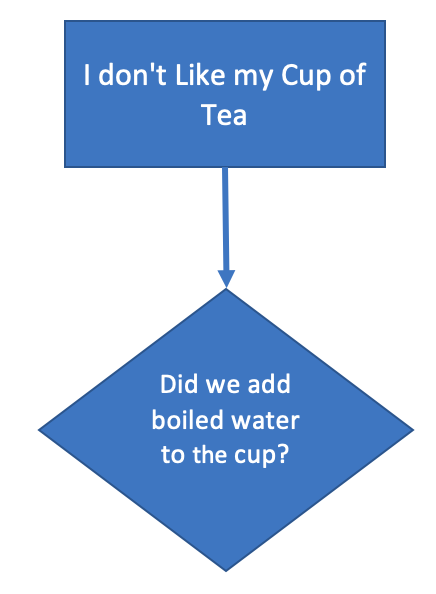
As a question, we want two possible routes – Yes and No.
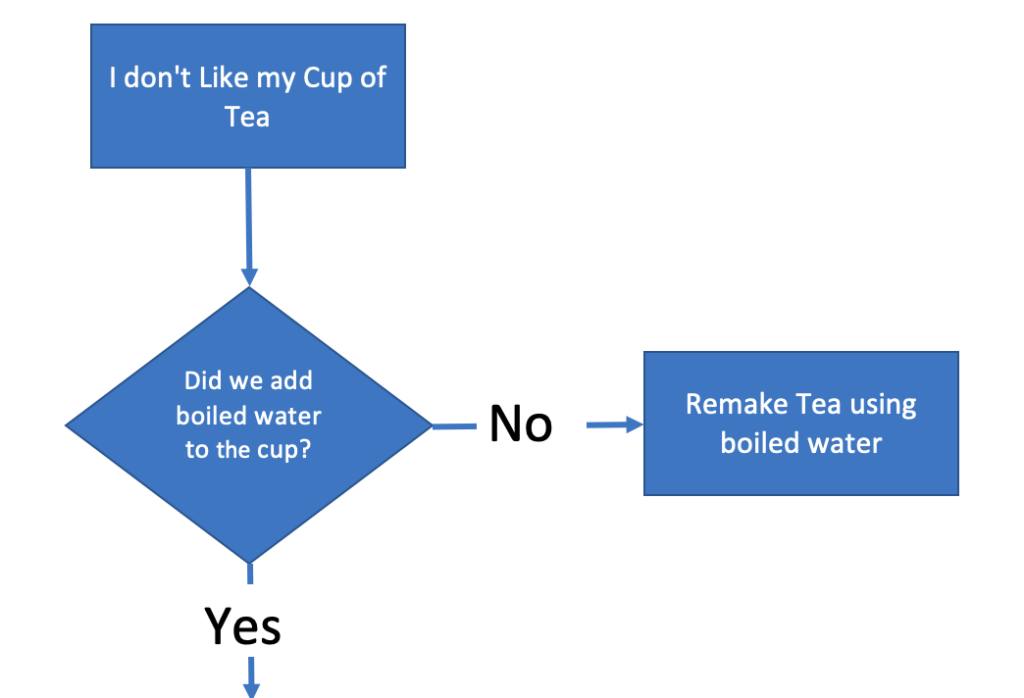
Our process asks us to boil the kettle if we did, and the answer is Yes, then we can go to the next process step.
If the answer is No, then we have a problem. Our tea will be cold.
Here we can do one of two things. We can terminate the flow chart, or we can add an activity to rectify the problem (this might be to remake the drink or to perhaps heat the drink up in the microwave).
Our flow chart now looks like this:
Step 2 in our Tea making process was to add a Breakfast-tea tea bag.
So, once again, we’ll ask a question about that step.
“Did we add an English Breakfast teabag.”
As before, we’ll use a question shape, using Yes or No answers. If we performed the process step correctly, we’d move on. If we didn’t, we’ll either end the problem solving (we’ve found the root cause), or we’ll add a corrective action.
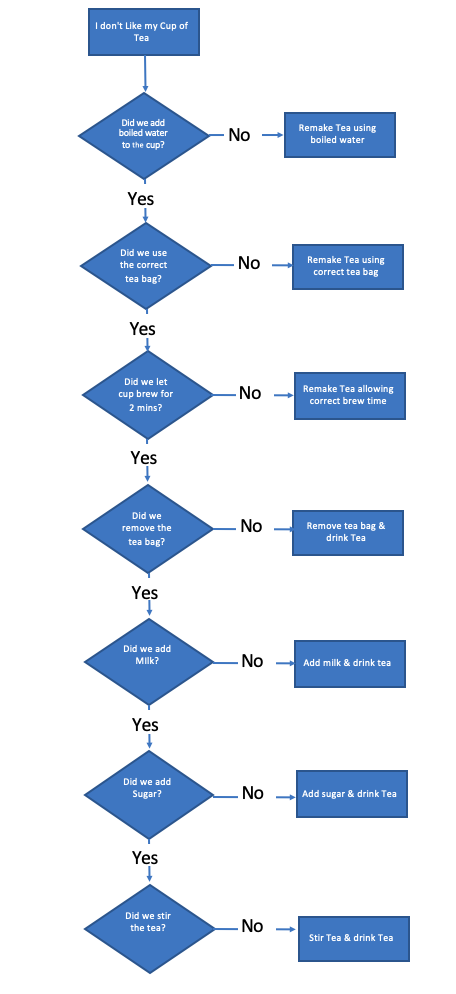
Now we’ll repeat this process until we’ve reviewed the whole process.
Our finished flowchart looks like this.
However, we’re not finished.
What happens if we follow the flow chart, and we find we didn’t use boiled water. We remake the tea using boiled water, and we still don’t like it?
We need to ask some further questions.
We need to update our flow chart to validate that we solved the problem and what to do if we didn’t.
So for each step of the process, our problem solving flowchart now looks like this.
Here’s our completed flow chart.
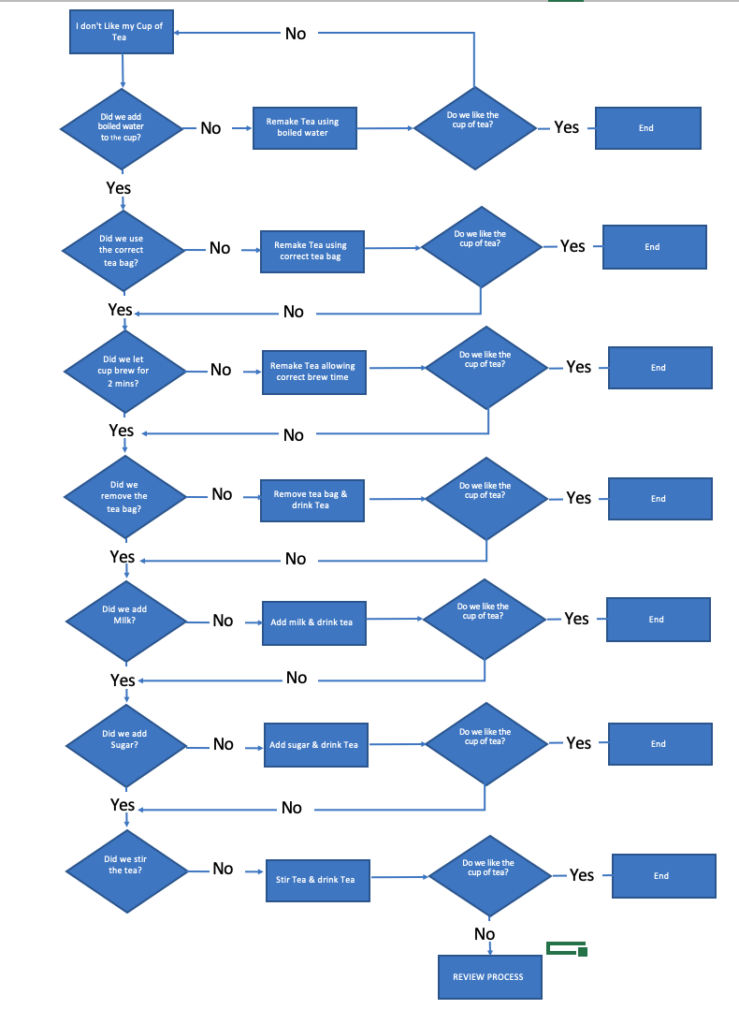
As you can see, we’ve identified the problem, and we’ve described a corrective action.
But there’s a problem here. With this flowchart, you can still follow it, validating the process, and still end up with a cup of tea that’s unsatisfactory.
Why is that?
Well, it’s perfectly possible that we started out with a process that’s incorrect. What happens if the process called for using an incorrect tea bag from the start?
So we’ll simplify things by adding a block at the end that if you’re still not happy at the end of reviewing the steps, a full review of the process will be undertaken. This is a simple answer to this problem, and I would expect that you would expand this section in more detail if you were creating a flowchart yourself.
So what does a more complex process look like, how about we look at a business problem?
Example 2 Problem Solving flow chart
OK, so example 1 may have been a bit simple, and you are maybe looking for something in a business context.
So in Example 2, let’s look at a scenario that’s a little more complex.
Let’s assume that your organization has received a non-conforming part. You have been assigned to work with the Vendor to:
- Find out what went wrong
- Prevent recurrence
We’re going to use a problem solving flow chart to help us do that.
As with the first example, we’re going to state the problem.
“The part is non conforming.”
Using the production process from the Vendor, we’ll work through the stages to see if we can spot what’s gone wrong.
The diagram below shows an analysis of the first two steps of the production process using a problem-solving flow chart.
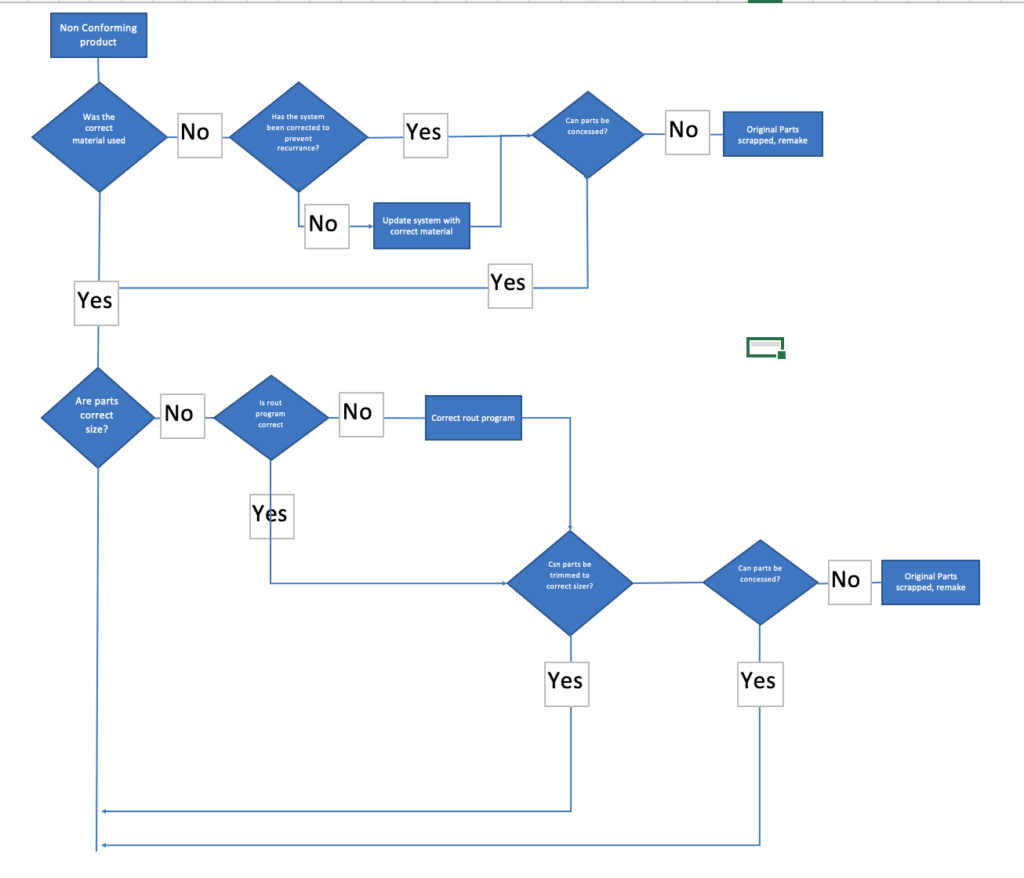
The first thing you’ll notice is that on one process step, there may be many questions to ascertain the potential issue.
Some of these may be complex and require careful thought.
There may be multiple variables (systems, processes, tools, inputs, etc.) that may require attention.
You will need to analyze each process step, in full, to be sure you have caught all the possible causes of the fault.
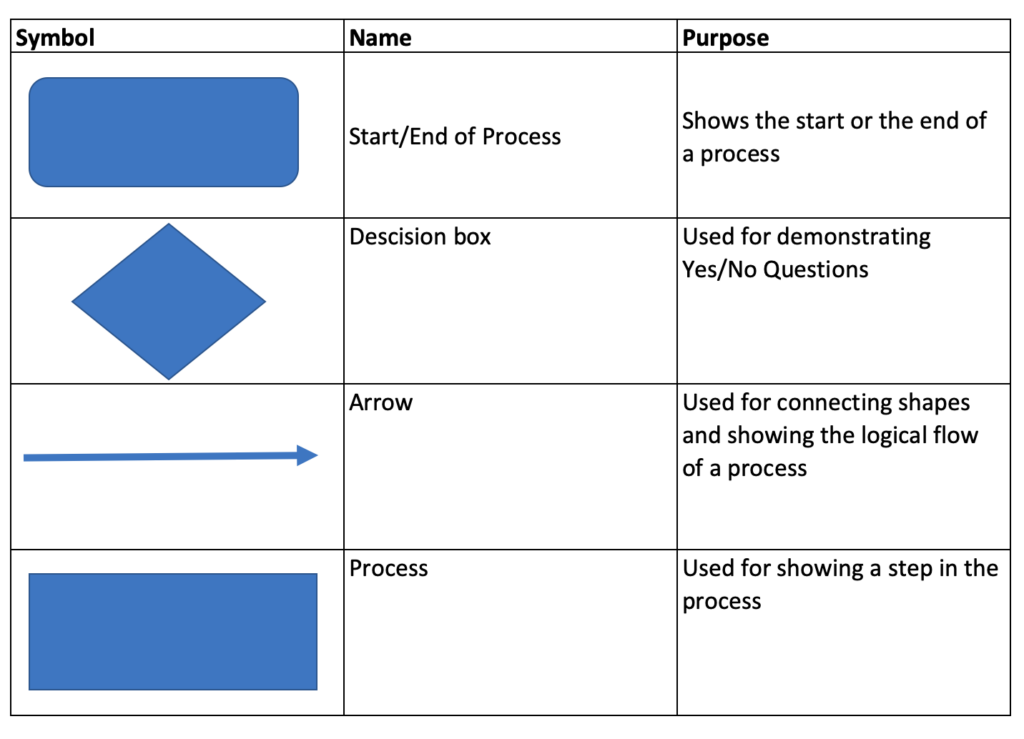
Which Flow chart shapes should you use.
A problem solving flow chart usually utilizes only a small number of shapes. We show these in the table below.
When should you use a Problem Solving flow chart
There are many many problem tools available.
A flow chart lends itself to be used when:
- You are looking for a tool that is simple to use
- You are looking to use a tool that does not require complex software
- You want to validate a process.
- You want something that facilitates collaboration
- You want something that you can use to communicate with others
7 Tips on creating great problem solving flow charts
1/ Use standard shapes!
2/ Make it easy to follow!
3/ Keep things on one page
4/ Don’t overload your boxes with text
5/ Go into enough detail. Don’t try and simplify activities as it might hide problems from being seen.
6/ Collaborate. Where you can utilize a team to help document the problem and the activities do so. The more knowledge of the process, the better chance you’ll have of locating the issue.
7/ Use a consistent direction to flow your process, moving things around the page can confuse people who might look at it.
A flow chart can provide you with a great advantage when looking to solve problems. Some of the key benefits include
- A visual aide that’s easy to understand
- Simple to use, does not require hours and hours of training
- A tool that facilitates collaboration
- Effective for aiding communication
- Provides an effective method of analysing a process
However, as with everything, there are some issues to look out for
- Flowchart fails to capture all process steps and therefore root cause analysis is hit and miss
- Lack of knowledge of the process by the individual compiling the flowchart results in inaccurate problem solving
- Inconsistent flow of process makes maps confusing
- Complex processes may be better suited to other tools (fishbone etc)
- Inconsistent formatting and/or use of shapes result in flowchart that is difficult to utilise.
There are a great many tools out there for problem-solving, and flow charts can be used either as a stand-alone tool or conjunction with one of these other tools.
Flowcharts can make for a great problem-solving tool.
They’re simple to use, effective, and facilitate collaboration.
We hope you’ve found our article useful, in particular the example walkthroughs.
If you’re looking to use the tool, we’d love some feedback from you and hearing how you’ve got on. Why not fire us a message on twitter or use the comments section below.
This article is part of our Problem Solving Guide.
Our Content
- Calculators
- Career Skills
- Communications
- Human Resources
- Strategy and Leadership
- Supply Chain Management
We use essential cookies to make Venngage work. By clicking “Accept All Cookies”, you agree to the storing of cookies on your device to enhance site navigation, analyze site usage, and assist in our marketing efforts.
Manage Cookies
Cookies and similar technologies collect certain information about how you’re using our website. Some of them are essential, and without them you wouldn’t be able to use Venngage. But others are optional, and you get to choose whether we use them or not.
Strictly Necessary Cookies
These cookies are always on, as they’re essential for making Venngage work, and making it safe. Without these cookies, services you’ve asked for can’t be provided.
Show cookie providers
- Google Login
Functionality Cookies
These cookies help us provide enhanced functionality and personalisation, and remember your settings. They may be set by us or by third party providers.
Performance Cookies
These cookies help us analyze how many people are using Venngage, where they come from and how they're using it. If you opt out of these cookies, we can’t get feedback to make Venngage better for you and all our users.
- Google Analytics
Targeting Cookies
These cookies are set by our advertising partners to track your activity and show you relevant Venngage ads on other sites as you browse the internet.
- Google Tag Manager
- Infographics
- Daily Infographics
- Popular Templates
- Accessibility
- Graphic Design
- Graphs and Charts
- Data Visualization
- Human Resources
- Beginner Guides
Blog Business What is a Problem-Solving Flowchart & How to Make One
What is a Problem-Solving Flowchart & How to Make One
Written by: Danesh Ramuthi Aug 10, 2023
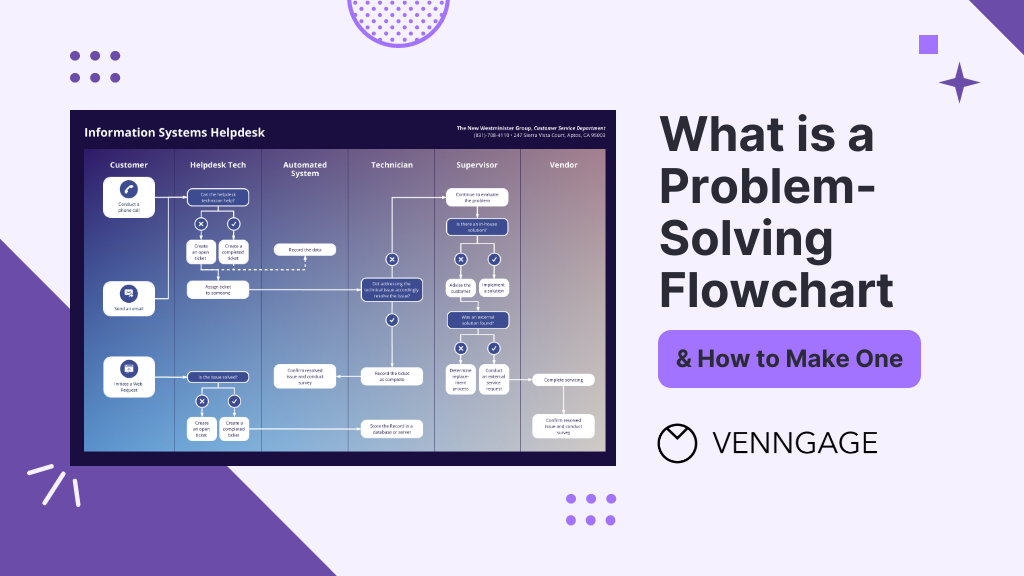
Problem-Solving Flowcharts, contrary to what many believe aren’t just aesthetic wonders — they’re almost like magical blueprints for troubleshooting those pesky problems that many of us face.
Flowcharts take business challenges and turn them into a navigable pathway. In this post, I will guide you on key aspects of problem-solving flowcharts such as what it is, the advantages of problem-solving flowcharts, how to create one and more.
Besides, you’ll also discover how to create problem-solving flowcharts with the help of Venngage’s Flowchart Maker.
And for those of you thinking, “I’m no designer, how can I create one?” worry not! I’ve got you covered. Just hop on Venggage’s Flowchart Templates and you’ll be charting your way to problem-solving glory in no time.
Click to jump ahead:
What are problem-solving flowcharts?
When to use problem-solving flowcharts, what are the advantages of flowcharts in problem-solving, what are the 7 steps of problem-solving flowcharts.
- 5 different types of problem-solving flowcharts
Best practices for designing effective problem-solving flowcharts
- How to make a flowch art using Venngage ?
Problem-solving flowcharts FAQs
- Final Thoughts
Problem-Solving Flowcharts is a graphical representation used to break down problem or process into smaller, manageable parts, identify the root causes and outline a step-by-step solution.
It helps in visually organizing information and showing the relationships between various parts of the problem.
This type of flowcharts consists of different symbols and arrows, each representing different components or steps in the problem-solving process.
By following the flow of the chart, individuals or teams can methodically approach problem, analyze different aspects of it and come to a well-informed solution.
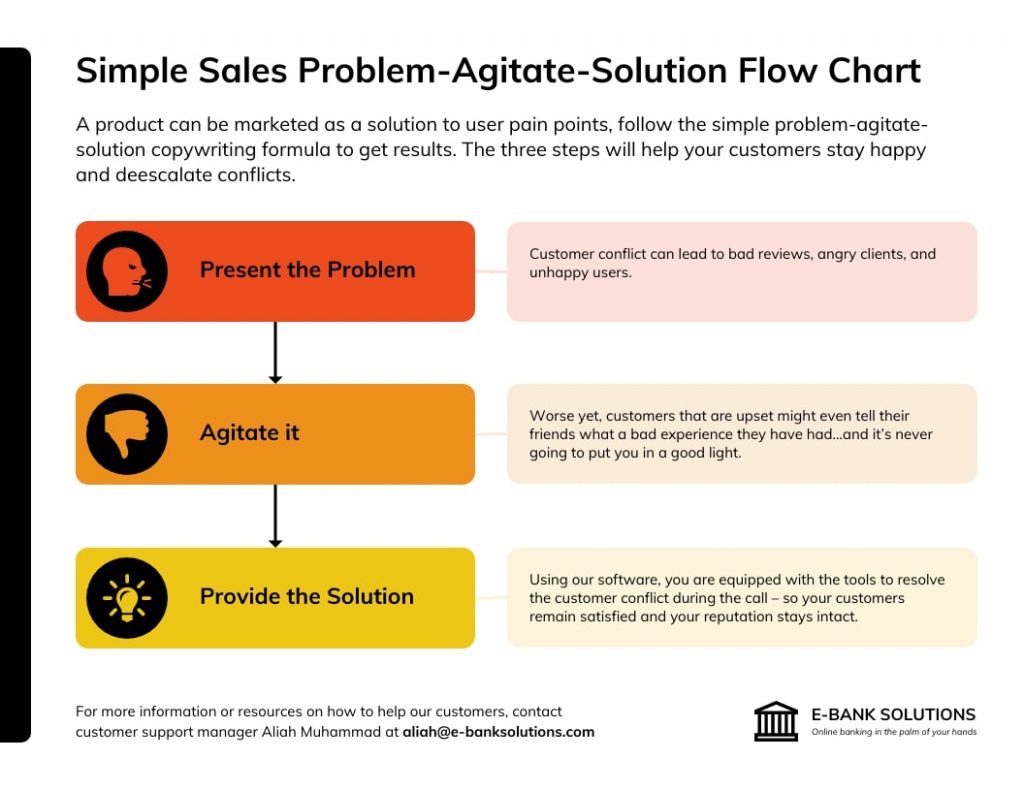
Problem-Solving Flowcharts is a versatile tool that can be used in various scenarios. Here’s when to consider utilizing one:
- Complex Problems: When faced with a multifaceted issue that involves multiple steps or variables, flowcharts can help break down the complexity into digestible parts.
- Team Collaboration: If you’re working with a team and need a common understanding of problem and its potential solutions then a flowchart provides a visual that everyone can refer to.
- Analyzing Processes: In a situation where you need to understand a particular process, whether it’s within a project or a part of regular operations then mapping it out in a flowchart can offer clarity.
- Decision Making: When various paths or decisions might be taken, a flowchart can outline the potential outcomes of each aiding in making an informed choice.
- Training and Onboarding: Flowcharts can be used in training materials to help new employees understand complex processes or procedures which makes the learning curve smoother.
- Identifying Root Causes: If you’re looking to identify the underlying causes of problem then a flowchart can facilitate a systematic approach to reaching the root of the issue.
Related: How to Use Fishbone Diagrams to Solve Complex Problems
Problem-solving flowcharts can offer several benefits to the users who are looking to solve a particular problem. Few advantages of flowcharts in problem solving are:
Visual Clarity
When you’re dealing with multifaceted problems or processes, words alone can make the situation seem even more tangled. Flowcharts distill these complexities into easily understandable visual elements.
By mapping out each phase or component of problem, flowcharts offer a bird’s eye view enabling individuals to grasp the bigger picture and the finer details simultaneously.
Sequential Representation
Flowcharts excel in laying out the sequence of events or actions. By indicating a clear starting point and illustrating each subsequent step, they guide users through a process or solution path methodically.
This linear representation ensures that no step is overlooked and each is executed in the right order.
Collaboration
Problem-solving often requires team effort and flowcharts are instrumental in fostering collaborative environments.
When a team is discussing potential solutions or trying to understand problem’s intricacies, a flowchart serves as a collective reference point.
It aids in synchronizing everyone’s understanding, minimizing miscommunications and promoting constructive discussions.
Read more about: Flowcharts Symbols and Meaning
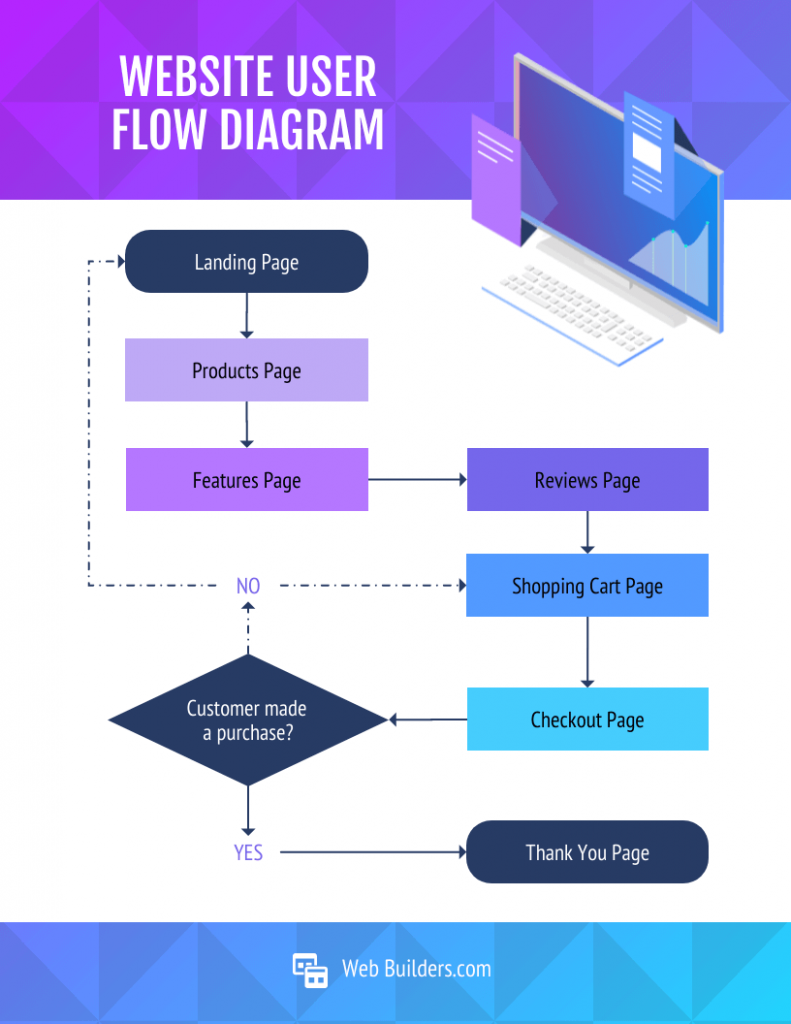
1. Define the Problem
Before anything else, it’s essential to articulate the problem or task you want to solve clearly and accurately. By understanding exactly what needs to be addressed you can ensure that subsequent steps align with the core issue.
2. Identify the Inputs and Outputs
Determine what inputs (such as data, information or resources) will be required to solve the problem and what the desired outputs or outcomes are. Identifying these factors will guide you in structuring the steps needed to reach the end goal and ensure that all necessary resources are at hand.
3. Identify the Main Steps
Break down the problem-solving process into its main steps or subtasks. This involves pinpointing the essential actions or stages necessary to reach the solution. Create a roadmap that helps in understanding how to approach the problem methodically.
4. Use Decision Symbols
In problem-solving, decisions often lead to different paths or outcomes. Using standard symbols to represent these decision points in the flowcharts allows for a clear understanding of these critical junctures. It helps visually present various scenarios and their consequences.
5. Add Descriptions and Details
A well-designed flowcharts is concise but clear in its labeling. Using arrows and short, descriptive phrases to explain what happens at each step or decision point ensures that the flowcharts communicates the process without unnecessary complexity.
6. Revise and Refine
Creating a flowcharts is not always a one-and-done process. It may require revisions to improve its clarity, accuracy or comprehensiveness. Necessary refinement ensures that the flowcharts precisely reflects the problem-solving process and is free from errors or ambiguities.
7. Use Flowchart Tool
While it’s possible to draw a flowcharts manually, using a flowcharts tool like Venngage’s Flowchart Maker and Venngage’s Flowchart Templates can make the process more efficient and flexible. These tools come with pre-designed templates and intuitive interfaces that make it easy to create, modify and share flowcharts.
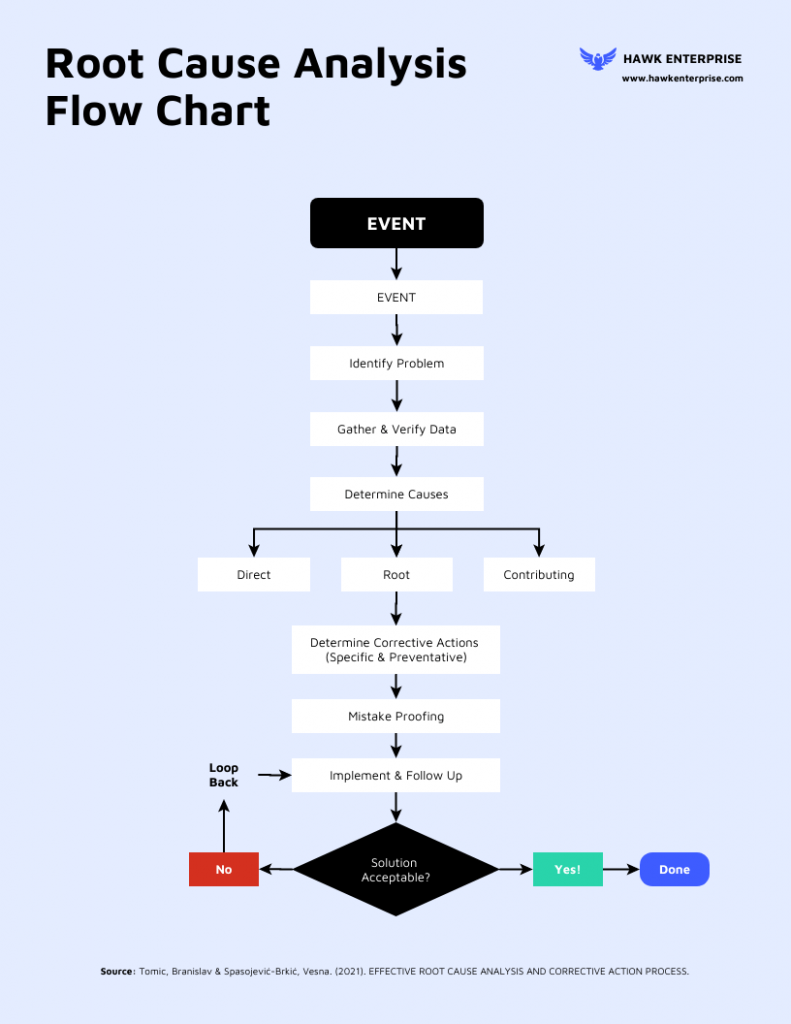
5 different types of problem-solving flowcharts
Let’s have a look at 5 most common types of flowcharts that individuals and organizations often use.
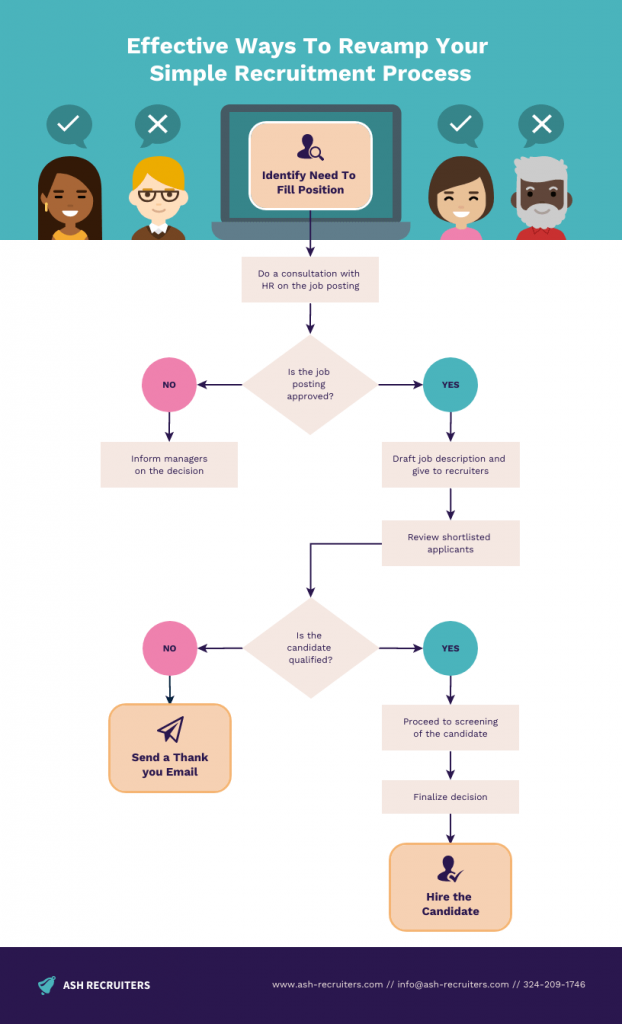
1. Process Flowchart s
A process flowcharts is a visual representation of the sequence of steps and decisions involved in executing a particular process or procedure.
It serves as a blueprint that showcases how different stages or functions are interconnected in a systematic flow and it highlights the direction of the process from its beginning to its end.
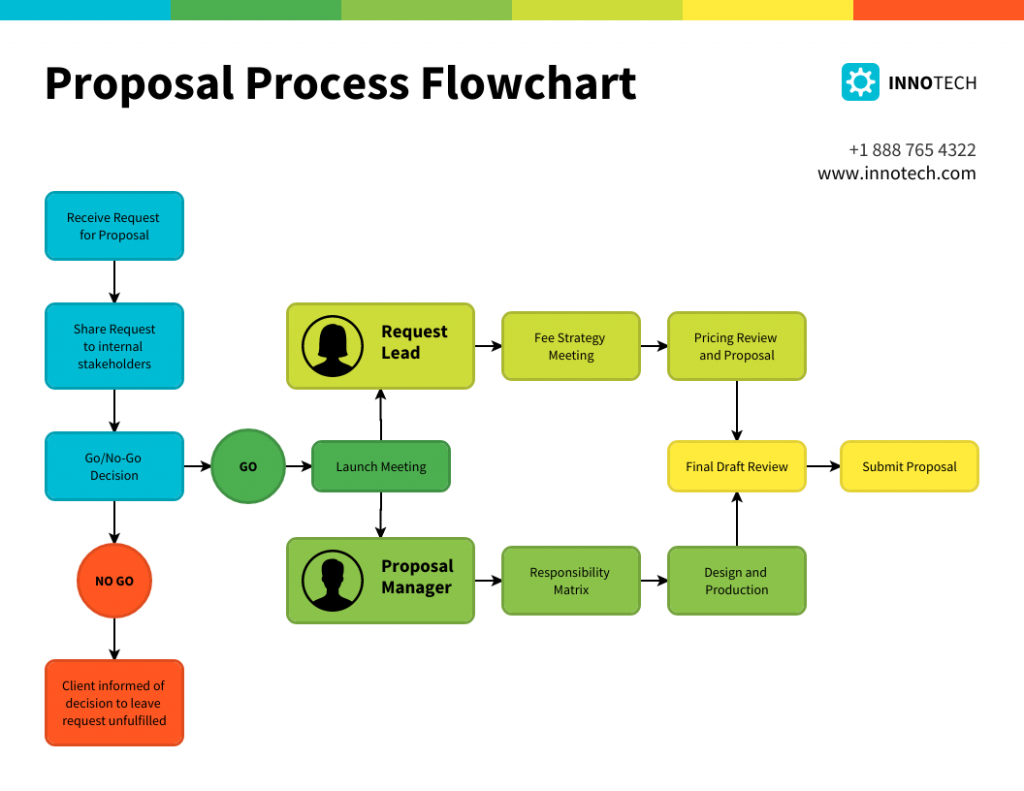
Process flowcharts are instrumental in training and onboarding, sales process , process optimization, documentation, recruitment and in any scenario where clear communication of a process is crucial.
2. Flowcharts Infographic
A flowcharts infographic is a great way to showcase the process or a series of steps using a combination of graphics, icons, symbols and concise text. It aims to communicate complex information in a clear and easy-to-understand manner, making it a popular tool for conveying information, data and instructions in a visually engaging way.
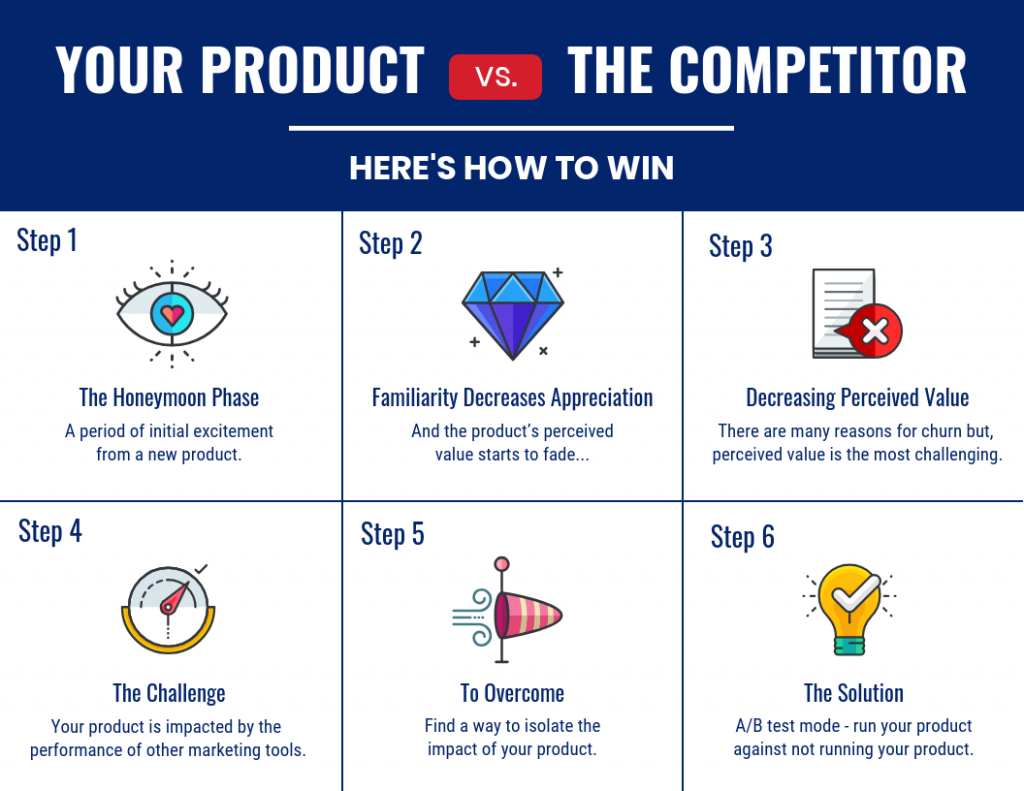
For example, you can use this flowchart to illustrate a health insurance process that visually explains the steps involved from finding a provider to paying for your healthcare provider.

3. Circular Flowcharts
A circular flowcharts is used to illustrate the flow of information, goods, services or money within a closed system or process. It gets its name from its circular shape, which emphasizes the continuous and cyclical nature of the flow.

Circular flowcharts are widely used in various fields such as economics, business, engineering and process management to help visualize and understand complex systems.
In a circular flowcharts , elements are represented using various shapes and connected with arrows to indicate the direction of flow. The circular arrangement indicates that the process is ongoing and repeats itself over time.

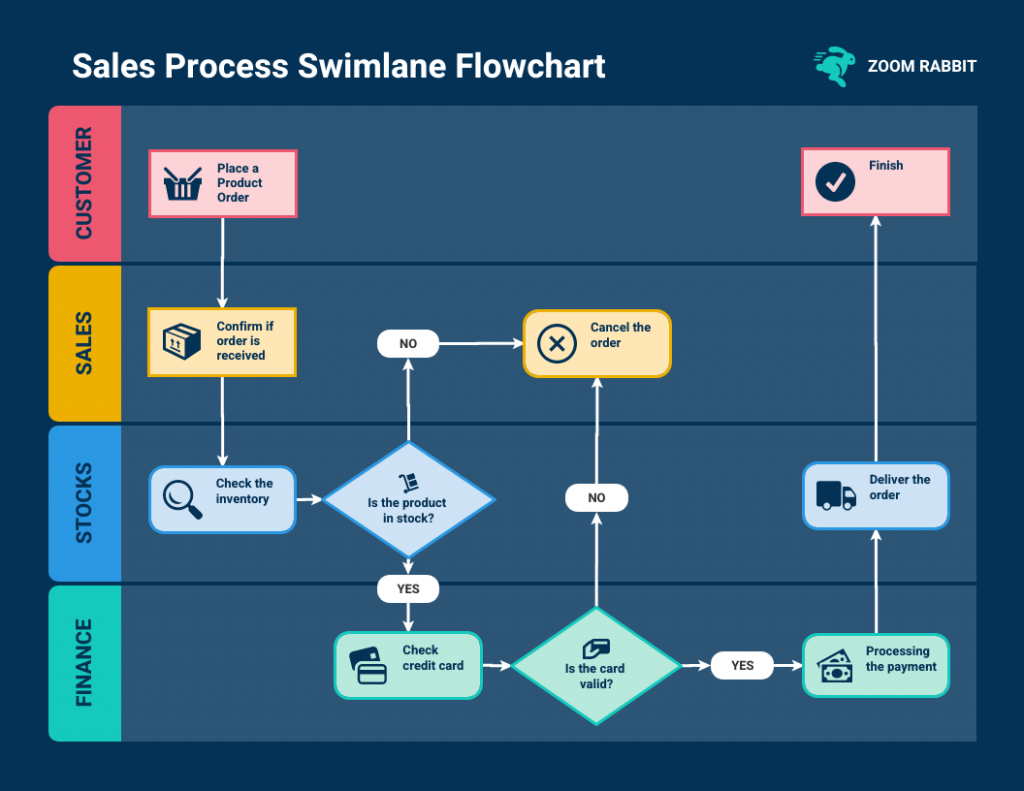
4. Swimlane flowcharts
Swimlane flowcharts , also known as cross-functional flowcharts are a specific type of flowchart that organizes the process flow into lanes or “swimlanes.”
Each lane represents a different participant or functional area involved in the process and the flowchart shows how activities or information move between these participants.
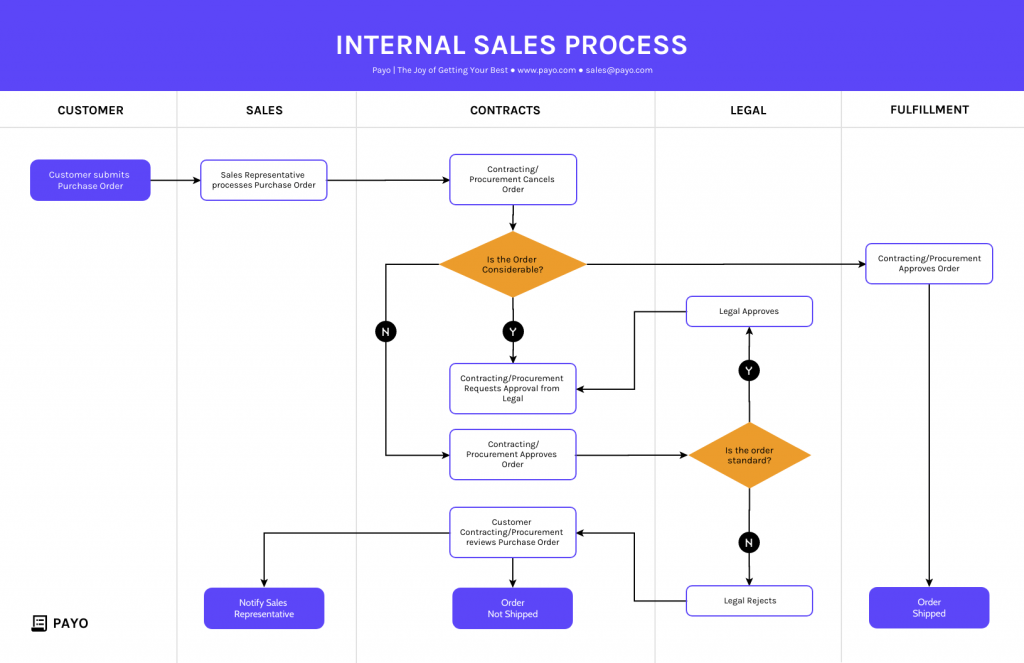
Swimlane flowcharts are particularly useful for illustrating complex processes that involve multiple stakeholders or departments.
In a swimlane flowcharts, the process is divided horizontally into lanes and each lane is labeled with the name of the department, person or role responsible for that part of the process. Vertically, the flowchart displays the sequence of steps or actions taken in the process.
5. Decision Flowchart s
Decision flowcharts, also known as decision trees or flow diagrams are graphical representations that illustrate the process of making decisions or solving problems.
They are widely used in various fields such as computer science, business mapping , engineering and problem-solving scenarios.
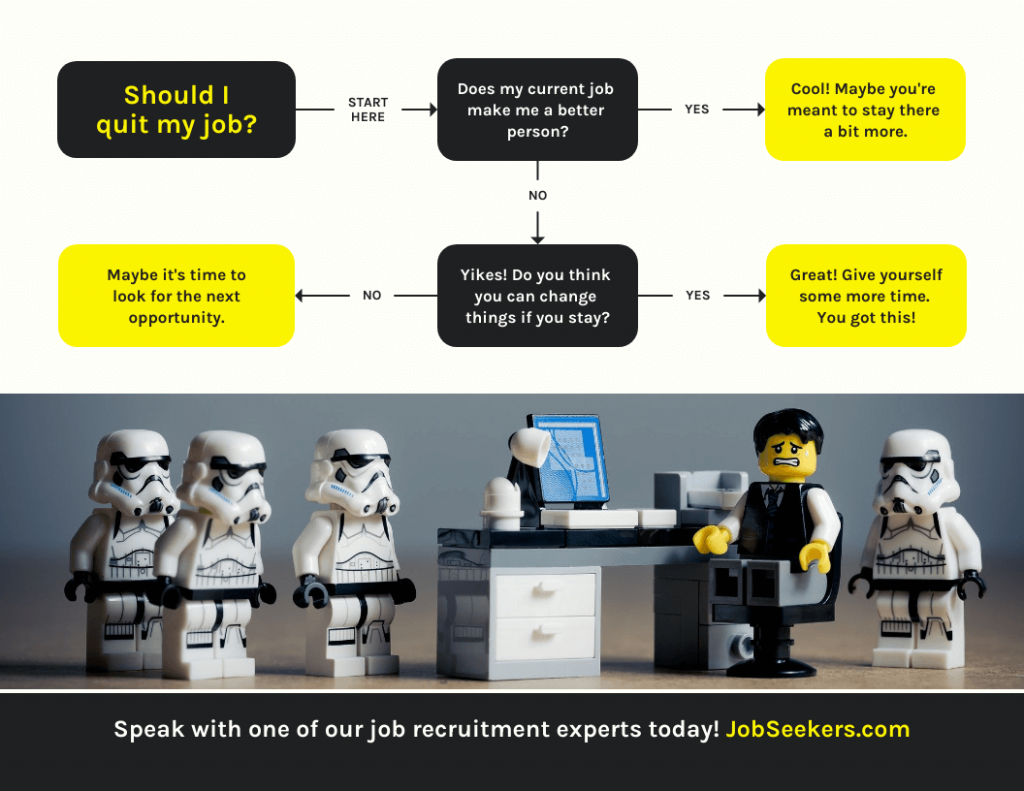
Decision flowcharts help break down complex decision-making processes into simple, sequential steps, making it easier to understand and follow.
A decision tree is a specialized flowchart used to visually represent the process of decision-making.
Businesses and other individuals can employ a decision tree analysis as a tool to aid in evaluating different options and the possible consequences associated with each choice.
Decision trees Infographics can be used to create a more nuanced type of flowchart that is more informative and visually appealing by combining a decision flowchart and the flowchart infographic.
Decision flowcharts are valuable tools for visualizing decision-making processes, analyzing complex problems and communicating them effectively to others.
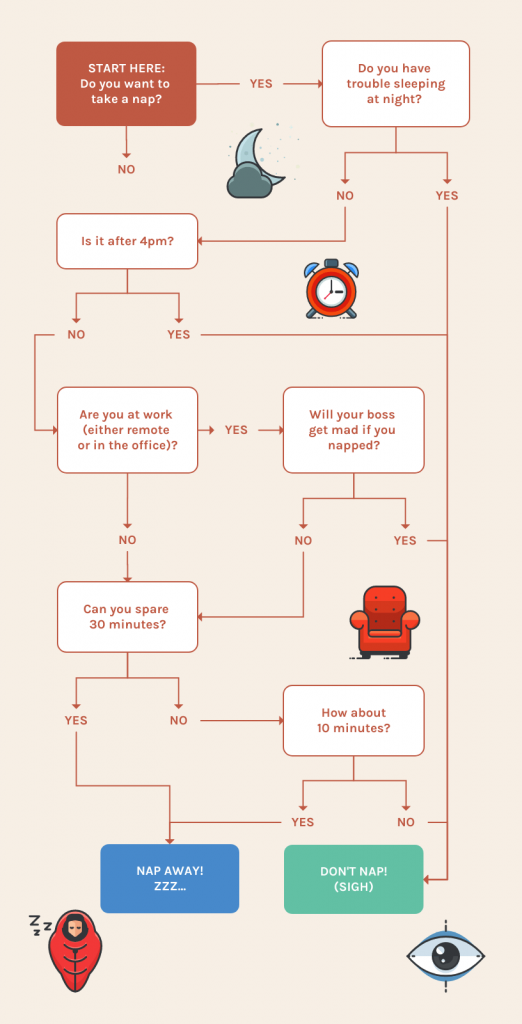
Designing effective problem-solving flowcharts involves careful consideration of various factors to ensure clarity, accuracy and usability. Here are some best practices to create efficient and useful problem-solving flowcharts:
- Understand the problem first & clearly define it
- Keep it simple
- Use standard & recognizable symbols
- Ensure that the flowchart follows a logical and sequential order
- Clearly label each decision point, action and outcome
- Verify the flowchart’s accuracy by testing it
- Clearly state the decision criteria that lead to different branches
- Provide context when the flowchart is part of a larger process or system
- Review and revise the flowchart
How to make a flowchart using Venngage ?
Creating problem-solving flowchart on Venngage is incredibly simple. All you have to do is:
- Start by Signing Up and Creating an Account with Venngage
- Choose a flowchart template that best suits your needs from our library.
- Start editing your flowchart by choosing the desired shapes, labels and colors.
- You can also enhance your flowchart by incorporating icons, illustrations or backgrounds all of which are readily available in our library.
- Once done, you will have 2 options to choose from, either sharing it online for free or downloading your flowchart to your desktop by subscribing to the Premium or Business Plan.
Is flowchart the representation of problem solutions?
Flowcharts are not the representation of problem solutions per se; rather, they are a visual representation of processes, decision-making steps and actions taken to arrive at a solution to problem.
What are the 3 basic structures of flowcharts?
3 Basic Structures of Flowcharts are:
- Sequence: Simplify Complexity
- Selection (Decision): Embrace Choices
- Repetition (Loop): Emphasize Iteration
What are the elements of a good flowchart?
A good flowchart should exhibit clarity and simplicity, using consistent symbols and labels to depict a logical sequence of steps. It should be readable, with appropriate white space to avoid clutter while eliminating ambiguity through well-defined decision criteria and paths.
Can flowcharts be used for both simple and complex problem-solving?
Yes, flowcharts can be used for both simple and complex problem-solving scenarios. Flowcharts are versatile visual tools that can effectively represent various processes, decision-making steps and problem-solving approaches regardless of their complexity.
In both cases, flowcharts offer a systematic and visual means of organizing information, identifying potential problems and facilitating collaboration among team members.
Can problem-solving flowcharts be used in any industry or domain?
Problem-solving flowcharts can be used in virtually any industry or domain. The versatility and effectiveness of flowcharts make them applicable to a wide range of fields such as Business and Management, Software Development and IT, Healthcare, Education, Finance, Marketing & Sales and a lot more other industries.
Final thoughts
Problem-solving flowcharts are a valuable and versatile tool that empowers individuals and teams to tackle complex problems with clarity and efficiency.
By visually representing the step-by-step process of identifying, analyzing and resolving issues, flowcharts serve as navigational guides simplifying intricate challenges into digestible parts.
With the aid of modern tools like Venngage’s Flowchart Maker and Venngage’s Flowchart Templates , designing impactful flowcharts becomes accessible to all while revolutionizing the way problems are approached and solved.
Discover popular designs

Infographic maker

Brochure maker

White paper online

Newsletter creator

Flyer maker

Timeline maker

Letterhead maker

Mind map maker

Ebook maker
Visualization for innovation: How to use flowcharts for smarter problem solving

In December 1921, industrial psychologists Lillian Gilbreth and Frank Bunker Gilbreth presented a new model for problem solving to the American Society of Mechanical Engineers in New York City.
Their “process chart” — known today as a flowchart — is a method of visualizing a process in order to improve it. More than one hundred years later, companies from manufacturing to tech startups use flowcharts to pinpoint bottlenecks, improve efficiency, and enhance decision-making for their biggest challenges.
How flowcharts simplify problem solving
Visualizing a problem lets us see it in its entirety and process how different components interact. That’s because, according to the Gestalt Principles , with visual representation, our minds can quickly perceive individual elements as a whole and understand a problem better.
“Every detail of a process is more or less affected by every other detail,” the Gilbreths theorized . “Therefore, the entire process must be presented in such [a] form that it can be visualized all at once before any changes are made in any of its subdivisions.”
Once you see how individual elements work together to create a process, you can take steps to modify elements to improve the whole.
- What is a problem-solving flowchart?
A problem-solving flowchart is a flowchart that helps process improvement, troubleshooting, or decision-making. Flowcharts use shapes, symbols, and connecting arrows to map out a problem or flow. This technique illustrates how many steps are in a process, entry and endpoints, the flow of information and materials, and any branches or decision points.
For example, this problem-solving flowchart template shows how you can use a flowchart to troubleshoot a technical problem. The flow guides users through basic questions and actions to a likely solution.
Use this template
- When to use a flowchart for problem solving
Flowcharts can be useful in several instances:
- When you’re aware of a problem, but aren’t sure of the root cause or the best way to solve it.
- When you want to improve a product or service or specific outcomes, like delivery time.
- When you’re entering a new market and want to create solutions that are a market fit for real customer problems.
You can also explore flowchart templates to visualize and structure your thought process more effectively, helping you identify potential bottlenecks, inefficiencies, or steps in your strategy that need refinement.
- The stages of problem solving
To understand how to use flowcharts for problem solving, we’ll use the double diamond design-thinking process . This approach divides problem solving into four stages: discover, define, develop, and deliver. Most people start problem solving in the middle of the diamonds, believing that they know the problem and can start on solutions right away. Instead, you should start even earlier.

https://www.designcouncil.org.uk/our-resources/the-double-diamond
1. Discover
Starting with research helps people understand, rather than simply assume, the problem. Design Council co-founder Jonathan Ball advises , “Go back and ask, ‘Have I been asked to solve the right problem?’”
Problem-solving requests normally come to product or engineering teams from leadership or customers. Statements like “This isn’t selling well” or “This process takes too long” describe pain points, but they’re too vague to form functional solutions.
There are multiple ways to explore the root of a problem:
- Qualitative user research like user interviews
- Quantitative user research like user testing and heatmap tracking
- Workshops, like Upwork’s problem-solving workshop with Miro that led participants through brainstorming, discussing, and voting on top problems to solve
- Flowcharts to illustrate challenges in the “as-is” process .
As-is process mapping
Flowcharts can help solve problems by first mapping out the problematic process. If a process map doesn’t exist, isn’t updated, or hasn’t been well communicated, this is the best starting point.
Ask all teams involved to participate in mapping out the current process. During the process, you may identify bottlenecks or areas of misunderstanding.
Next, refine your discovery into a single statement. A problem statement should explain who is affected, their end goal, the challenge, and the impact of the challenge. Here’s an example of a problem statement:
“Users of [software name] encounter frustration when they try to customize a monthly sales report. They are not able to customize the data within the platform reporting, and instead are abandoning the process and exporting raw data to compile outside of the platform. This takes longer, makes it harder for them to reach business goals, and lowers satisfaction with the software.”
You can get to the heart of a problem by asking why solving the problem is important and how the problem originated. Miro’s problem statement template is useful for this exercise.
Once you’ve defined the problem, you’re ready to move to the second diamond — the solution space. Flowcharts are ideal for mapping out potential solutions for testing. Just like an as-is process map, a proposed or to-be process map illustrates how a process should work, showing entry points, decision points, actions, parties, and endpoints.
In the development stage, use testing to reject ideas that don’t work and refine your solution. “The earlier and more often you can prototype and test, the better the outcome will be,” shares Ball.
It’s important to note that changing a process isn’t always the solution to your problems. Simply visualizing it and addressing misplaced expectations can also be a solution.
Once you ship a solution, your work isn’t done. Communicate the update to users, collect feedback, track outcomes, and commit to continuous improvement .
- How to make a visual problem-solving flowchart
Interested in trying your hand at visual problem solving? The specific techniques for visual problem solving are as numerous as there are problems, but below we’ll outline three to get you started. All of them use Miro as their foundation, which allows for collaboration in real time, so you can create effective visuals to guide your process.
1. Cyclical problem-solving process
This structured problem-solving process by Senior UX Designer Marcos Rezende walks teams through eight steps for tackling organizational challenges. It includes identifying the problem, gathering and analyzing data, generating solutions, and implementing them. Because this process is cyclical, it’s valuable for continuous improvement.
2. Cross-functional flowchart
If you’re attempting to solve internal workflow problems, a cross-functional flowchart can help you pinpoint challenges across silos. This template from Hiro Studio walks teams through outlining process steps and their relationships, identifying unnecessary complexity or duplication, and uncovering opportunities for improvement.
Consultant John White explains why this technique is effective: “When we document a process flow, we get everyone on the same page by removing assumptions of what we think is happening, and we document what is actually happening.”
Embed intro video: https://miro.com/miroverse/cross-functional-flowchart/
3. Problem tree
Instead of a traditional flowchart, this technique visualizes a problem as a tree. This visualization approach is designed to give a holistic view of a problem (the tree trunk) with its impacts (branches) and root causes (roots).
- Frameworks for decision-making
Beyond flowcharts, visualization can help leaders make better decisions by framing decision criteria in visual form. Here are a few ways you can illustrate your thought process in visual form for more effective decisions.
1. Risk matrix template
This risk matrix template helps leaders visualize the likelihood of adverse events happening by placing them on a matrix from rare to very likely and trivial to extreme.
2. Project scope template
How often do you need to argue that a request is “out of scope”? This simple framework helps you define a project scope at the beginning, so you have a touchstone to return to as a project evolves. This helps to manage goals, increase clarity, and keep projects within timeline and budget.
2. Priority matrix template
When you have competing priorities, deciding how to invest your time and budget is difficult. To determine the best outcomes, use this priority matrix template to map out initiatives by urgency and importance. This brings agility to your team and keeps your focus on what matters most.
You can find more decision-making visualization templates here .
- From visualization to optimization: How visual problem solving leads to innovation
Over a century after its birth, the flowchart remains a valuable tool to help companies approach a problem differently, using visual cues to understand all the moving parts.
With flowcharts and other visual tools, you can:
- Explore and define the right problem to solve
- Map out current processes to pinpoint the root cause of problems
- Propose and test new workflows and solutions
- Visualize a problem at a high level and work through frameworks for better decisions
Visualizing problems helps our brains “see” problems and solutions where we might have otherwise missed a connection. Using problem-solving flowcharts as a tool, you’ll set your teams up for better communication and innovation, too.
Ready to create flowcharts with just a few easy clicks?
Keep reading, unlocking clarity: mastering flow diagrams for complex process improvement.
Diagram design 101: Tips for effective visual diagrams to supercharge innovation

Achieve continuous improvement with as-is and to-be process mapping

Problem-solution

What is the problem-solution chart template?
Benefits of using the problem-solution chart template, how to use the problem-solution chart template in lucidchart, related templates.

Writing outline, hamburger format

Vocabulary List Graphic Organizer

Decimal division 0-9 puzzle
Problem Solving Template
Download Template:
Get EdrawMax Now!
Share Template:
- Process Flowchart
- Cross-Functional Flowchart
- Data Flow Diagram
- IDEF Diagram
- Basic Org Chart
- Photo Org Chart
- Creative Org Chart
- Family Tree
- Rack Diagram
- Network Topology
- CCTV Network
- AWS Diagram
- Azure Diagram
- GCP Diagram
- Cisco Network
- Active Directory
- Neural Network
- Column Chart
- Doughnut Chart
- Spider Chart
- Scatter Plot
- Bubble Chart
- Gauges Chart
- Comparison Chart
- Seating Plan
- Office Layout
- Garden Design
- Wiring Plan
- Security and Access Plan
- Fire Escape Plan
- Reflected Ceiling Plan
- Plumbing and Piping Plan
- Arrow Diagram
- List Diagram
- Pyramid Chart
- Venn Diagram
- Circular Diagram
- 2D Block Diagram
- 3D Block Diagram
- SWOT Matrix
- Brainstorming
- Marketing Diagram
- Fishbone Diagram
- Value Stream Map
- Enterprise Architecture
- Concept Map
- Bubble Diagram
- Strategy and Analysis
- Main Idea and Details
- Sequence Chart
- Compare and Contrast
- Vocabulary Study
- Grid and Matrix
- Fact and Opinion
- K-12 Education
- Process Flow Diagram
- Electrical Diagram
- Circuit and Logic
- Schematic Diagram
- Laboratory Equipment
- Human Anatomy
- Mathematics
- Gantt Chart
- Project Timeline
- Quotation Form
- Report Form
- UML Diagram
- Database Diagram
- Directional Map
- More Templates

Decoding the Problem Solving Chart – Visual Tools for Effective Analysis
Navigating the Complexity of Problem-Solving
Hey there, we’ve all been. You’re faced with a problem that seems like a mountain, complex and towering. It’s overwhelming. We understand that feeling and are here to help you navigate it. Problem-solving can be tricky, but remember, every problem, no matter how big, can be broken down and sorted out. It’s just about finding the right tools to do so.
One such powerful tool is visualization. Imagine having a map to navigate through the labyrinth of your problem. Sounds good. In this article, we will discuss the importance of visual tools in problem-solving and introduce you to the concept of a problem-solving chart. This chart will guide you, helping you break down your problem and find the most effective solutions. So, take a deep breath and get ready to conquer that mountain. Remember, you are not alone in this journey. We’re here to help you every step of the way. Let’s dive in and uncover the power of visual problem-solving together.
Understanding the Problem-Solving Chart
Let’s face it: we’ve all encountered problems in the workplace that seem impossible to overcome. They drain our energy, spike our anxiety levels, and can feel like a massive roadblock in our career progression. But what if I told you there’s a tool that could help you tackle these problems head-on? Enter the problem-solving chart.

What is a Problem-Solving Chart?
A problem-solving chart, a flowchart, is a visual tool to break down and understand complex problems. It’s designed to help you analyze the situation, identify possible solutions, and evaluate the results. Think of it as your problem-solving map, guiding you from confusion to clarity.
Components of a Problem-Solving Chart
A typical problem-solving chart consists of several vital components. Don’t worry if this feels overwhelming – I promise it’s simpler than it sounds!
- Problem: This is the issue you must resolve. It needs to be defined clearly and concisely.
- Causes: These factors have contributed to the problem. Understanding these will help you get to the root of the issue.
- Solutions: These are the potential ways to solve the problem. Brainstorming multiple solutions is always good, increasing the chances of finding the most effective one.
- Evaluation: This is where you assess the solutions to see the best. You’ll need to consider the pros and cons of each one.
- Implementation: This is the action stage, where you put the chosen solution into practice.
- Review: Finally, you’ll review whether the solution was effective. If it wasn’t, it’s back to the drawing board with more knowledge and insights than before.
Benefits of the Problem-Solving Chart
You might ask, “Why should I go through all this effort?” Well, there are several benefits to using a problem-solving chart:
- It simplifies complex problems: Breaking down the problem into smaller parts makes it less intimidating and more manageable.
- It promotes critical thinking: This process encourages you to think deeply about the problem and its solutions.
- It leads to practical solutions: As you thoroughly analyze and evaluate different options, you will likely find a solution that works.
- It saves time in the long run: While creating the chart may take time initially, it can save you time later by avoiding ineffective solutions.
- It serves as a learning tool: Even if a solution doesn’t work, the process helps you better understand the problem, making you better equipped to solve similar problems.
So, the next time you’re faced with a challenging problem, don’t let anxiety get the better of you. Arm yourself with a problem-solving chart and conquer those challenges like the career superstar you are. You’ve got this!
The Role of Visual Tools in Effective Analysis
We all know that information is king in today’s dynamic work environment. But let’s face it, dealing with tons of data can be daunting, especially when you’re expected to analyze and make sense of it all. So, how can we make this process less intimidating and more efficient? Enter visual tools. These are your new best friends when it comes to data analysis.
Discussing Various Types of Visual Tools
First, let’s dive into the different visual tools available to you. It can feel overwhelming with so many out there but don’t worry, we’ll break it down:
- Charts and graphs : Bar graphs, line graphs, pie charts – you name it. These are the most common visual tools for displaying trends, comparisons, and distributions.
- Infographics : These are a fun and creative way to present complex information in an easily digestible format.
- Dashboards : Think of these as your control panel. They provide a real-time snapshot of critical data and metrics at a glance.
- Diagrams : Flowcharts, Venn diagrams, and mind maps illustrate processes and relationships.
Understanding How Visual Tools Aid in Problem-Solving
Now, let’s address the elephant in the room. You may wonder, “How can these visual tools help me?” Well, let me tell you, they’re game-changers in problem-solving.
Visual tools help you see patterns, correlations, and trends that you might otherwise miss in raw data. They break down complex data into manageable, understandable pieces. Think of them as your lifeline when you’re drowning in data.
The Importance of Visual Tools in Communication and Team Collaboration
Lastly, remember visual tools’ crucial role in communication and team collaboration. We’ve all been in those meetings where someone is droning on about numbers and statistics, and it’s all just going over your head.
Visual tools are the answer to this problem. They make data accessible and understandable to everyone, regardless of background or expertise. They allow teams to see the bigger picture and work together more effectively towards common goals. In short, visual tools are your secret weapon for effective communication and collaboration.
In conclusion, don’t let data analysis intimidate you. There’s a wide range of visual tools ready to lend a helping hand. They’re your key to effective problem-solving and your ticket to better communication and collaboration within your team. So, embrace them and watch your efficiency and understanding skyrocket.
Practical Steps to Create a Problem-Solving Chart
Let’s face it: problems are an inevitable part of life. They can range from minor hiccups to significant hurdles that can feel overwhelming at work. Feeling anxious or even a bit scared is okay. Most of us do when faced with challenges at work.
Remember, every problem is an opportunity to learn and grow. And this guide is here to help you do just that. Let’s break down the process into four manageable steps that you can follow to create a problem-solving chart.
Identifying the Problem
First, you can only solve a problem if you understand it. Maybe you’re feeling stressed because deadlines are piling up. Or you may be struggling with a difficult coworker.
Take some time to get to the heart of the issue. Please write it down. Be specific and detailed. This way, you’ll clearly understand what you’re up against. It’s like untangling a knot — once you get a good look at it, you can see where to begin unraveling.
Developing Possible Solutions
Now that you’ve got a clear picture of the problem, it’s time to brainstorm. Don’t limit yourself. Think of as many solutions as you can.
You might feel stuck here, and that’s completely normal. But remember, there’s no such thing as a bad idea at this stage. Let your creativity flow and jot down every idea that pops into your head.
Evaluating and Selecting the Best Solution
Once you’ve got a list of potential solutions, it’s time to evaluate them. This can be tricky. You might worry about making the wrong choice or taking a risky path.
But don’t worry. Take each idea and weigh its pros and cons. Consider the resources you have and the possible outcomes. This process will help you select the best solution that’s feasible, effective, and aligns with your work goals.
Creating a problem-solving chart is daunting, especially when you’re already dealing with a challenging situation. But remember, you’re not alone in this. Everyone faces problems, and everyone can overcome them.
So, take a deep breath. Keep this guide close. Step by step, you’ll solve your current problem and equip yourself with the skills to tackle future challenges. You got this!
Case Studies of Successful Problem-Solving Chart Applications
You’re not alone if a complex problem at work has stumped you. We’ve all been there, scratching our heads, wondering how to untie the Gordian knot of challenges that confront us. But the good news? There are tools out there designed to help us conquer these hurdles. One such tool is the problem-solving chart. Let’s explore real-world examples to see how these charts have led to effective problem resolution.
Presenting real-world examples of problem-solving charts
- Case Study 1: A renowned software company struggled with a recurring bug, drastically affecting their product’s efficiency. They turned to a problem-solving chart to identify the problem’s root cause and systematically eliminate each potential cause. The chart served as a visual guide, helping the team keep track of their progress and ultimately resolve the bug.
- Case Study 2: A logistics company faced a significant supply chain bottleneck. Using a problem-solving chart, they could visualize the problem, break it down into smaller, manageable sections, and devise effective solutions. The result? A smoother, more efficient supply chain.
Analyzing how these charts led to effective problem resolution
The problem-solving charts played a crucial role in resolving the issues in both examples. They allowed the teams to:
- Visualize the problem clearly, breaking it down into manageable parts.
- Identify the root cause of the problem.
- Track potential solutions and their effectiveness.
These charts provided more than just a one-time solution. They also paved the way for a structured, systematic approach to problem-solving in the future.
Drawing lessons from these case studies
So, what can we learn from these case studies?
- Problem-solving charts are versatile: They can be used across various industries and for multiple issues, from software bugs to supply chain bottlenecks.
- Visualization aids understanding: A visual representation of the problem can make it easier to comprehend and tackle.
- A systematic approach is critical: These charts promote a step-by-step problem-solving method, making the process more manageable and less overwhelming.
Remember, every problem is an opportunity in disguise. With the right tools, like problem-solving charts, you can transform these challenges into stepping stones for success. So next time you face a complex problem at work, don’t despair. Try using a problem-solving chart and watch how it simplifies the process and leads you to a solution. You’ve got this!
Wrapping Up
Let’s take a moment to reflect on the journey we’ve embarked on together in this article. We have explored the tremendous potential of a problem-solving chart and how it can be a game-changer in your professional life. It’s completely natural to feel overwhelmed or apprehensive at first. You’re not alone in this. Remember, the benefits far outweigh the initial learning curve. A problem-solving chart can help streamline your thinking, foster productivity, and reignite your creativity – the critical ingredients for workplace success.
Now, I encourage you to take the plunge. Apply the knowledge you’ve gained here and watch as the magic unfolds. It may take some work to get through. Don’t let that discourage you. Each hiccup is a step towards mastering this tool, and with practice, you’ll find it becoming second nature.
As we wrap up, I want you to remember that change is rarely comfortable but is a necessary catalyst for growth. Your struggles and concerns are valid but don’t define your potential. Use this newfound knowledge as a stepping stone to navigate your professional challenges. It’s not just about solving problems; it’s about evolving as a professional and unlocking growth you never thought possible. So, embrace the journey and remember – you are more capable than you know.
Key Takeaways: Decoding the Problem Solving Chart
Tips for decoding the problem solving chart.
We all know that problem-solving can be a challenging task. Staring at a complex issue, not knowing where to start or how to unravel it, can be overwhelming. But don’t worry, you’re not alone in this. We’ve all been there, and feeling a bit lost is okay. That’s why we have these visual tools like problem-solving charts. They can seem intimidating initially, but once you understand how to use them, they are incredibly empowering.
Here are some tips:
- Understand the Purpose: The first step is to understand that a problem-solving chart is a tool to help you break down complex problems into manageable parts. It’s not a magic bullet, but it’s a great start.
- Identify the Problem: Start by writing down the problem you are trying to solve. Make it as specific as possible. It’s okay if it feels daunting at first; acknowledging the problem is the first step towards solving it.
- List Possible Solutions: Now, think of all possible solutions. Don’t worry about how practical they are for now. Just list them. This helps you open up to all possibilities.
- Analyze Each Solution: Now, list the pros and cons of each solution. This might be time-consuming, but carefully weighing each option is essential.
- Choose a Solution: Based on your analysis, choose the best solution. It’s okay if it’s not perfect. The aim is progress, not perfection.
- Take Action: Now, implement your chosen solution. Remember, it’s okay to make mistakes. They’re just opportunities to learn and improve.
- Review the Results: After implementing, review the results. Did it solve the problem? If not, don’t worry. It’s not a failure; it’s a learning opportunity. Go back to your chart and try a different solution.
This may seem like a lot of work, but problem-solving is a process. It takes time and patience. But with a problem-solving chart, you’re better equipped to handle whatever comes your way. Remember, you’re not alone in this. We all struggle with problem-solving at times. But with the right tools and mindset, you can overcome any challenge. Good luck!

Related Posts
Adapting to automation – how to future-proof your career, navigating the sustainable job market – green careers and opportunities, decoding freelancing: maximizing success in the gig economy.
Save my name, email, and website in this browser for the next time I comment.
Type above and press Enter to search. Press Esc to cancel.
- Activity Diagram (UML)
- Amazon Web Services
- Android Mockups
- Block Diagram
- Business Process Management
- Chemical Chart
- Cisco Network Diagram
- Class Diagram (UML)
- Collaboration Diagram (UML)
- Compare & Contrast Diagram
- Component Diagram (UML)
- Concept Diagram
- Cycle Diagram
- Data Flow Diagram
- Data Flow Diagrams (YC)
- Database Diagram
- Deployment Diagram (UML)
- Entity Relationship Diagram
- Family Tree
- Fishbone / Ishikawa Diagram
- Gantt Chart
- Infographics
- iOS Mockups
- Network Diagram
- Object Diagram (UML)
- Object Process Model
- Organizational Chart
- Sequence Diagram (UML)
- Spider Diagram
- State Chart Diagram (UML)
- Story Board
- SWOT Diagram
- TQM - Total Quality Management
- Use Case Diagram (UML)
- Value Stream Mapping
- Venn Diagram
- Web Mockups
- Work Breakdown Structure
Problem-Solving flowchart
The main responsibility in customer support is solving the issues customers are facing. You can use a flowchart to communicate the steps the user needs to take to arrive at a solution. In case, you are also having trouble understanding the issue faced by your customer, you can use a flowchart to analyze the issue and arrive at a solution.
You can easily edit this template using Creately's flowchart maker . You can export it in multiple formats like JPEG, PNG and SVG and easily add it to Word documents, Powerpoint (PPT) presentations, Excel or any other documents. You can export it as a PDF for high-quality printouts.
- Flowchart Templates
- Org Chart Templates
- Concept Map Templates
- Mind Mapping Templates
- WBS Templates
- Family Tree Templates
- VSM Templates
- Data Flow Diagram Templates
- Network Diagram Templates
- SWOT Analysis Templates
- Genogram Templates
- Business Model Canvas
- Pedigree Chart Templates
- Activity Diagram Templates
- Amazon Web Services Templates
- Android Mockups Templates
- Block Diagram Templates
- Business Process Management Templates
- Chemical Chart Templates
- Cisco Network Diagram Templates
- Class Diagram Templates
- Collaboration Diagram Templates
- Compare & Contrast Diagram Templates
- Component Diagram Templates
- Concept Diagram Templates
- Cycle Diagram Templates
- Data Flow Diagrams(YC) Templates
- Database Diagram Templates
- Deployment Diagram Templates
- Entity Relationship Diagram Templates
- Fishbone Diagram Templates
- Gantt Chart Templates
- Infographic Templates
- iOS Mockup Templates
- KWL Chart Templates
- Logic Gate Templates
- Mind Map Templates
- Object Diagram Templates
- Object Process Model Templates
- Organizational Chart Templates
- Other Templates
- PERT Chart Templates
- Sequence Diagram Templates
- Site Map Templates
- Spider Diagram Templates
- State Chart Diagram Templates
- Story Board Templates
- SWOT Diagram Templates
- T Chart Templates
- TQM - Total Quality Management Templates
- UI Mockup Templates
- Use Case Diagram Templates
- Value Stream Mapping Templates
- Venn Diagram Templates
- Web Mockup Templates
- Y Chart Templates
Related Templates
Problem-solving – Flowchart example
The flowchart starts with identifying a problem. After the problem is identified, data is gathered and analyzed. Then, the solution is developed and the best solution is identified. If it isn’t successful, the solution development process starts again. If successful, the plan is implemented and is improved continuously.

Edit this diagram in Gleek
Problem-solving diagram code in gleek.
Start:queue Identify the problem Data gathering Analyze data Solution development Identify the best solution Successful?:diamond Plan implementation Continue to improve Finish:queue Start–>Identify the problem Identify the problem–>Data gathering Data gathering–>Analyze data Analyze data–>Solution development Solution development–>Identify the best solution Identify the best solution–>Successful? Successful?-no->Solution development Successful?-yes->Plan implementation Plan implementation–>Continue to improve Continue to improve–>Finish
About Flowcharts
A flowchart, or flow chart, is a type of diagram that shows a step-by-step view of a process. Flowcharts document the tasks and decisions needed to achieve a specific goal. A basic flowchart is easy to make and understand. Businesses, engineers and software designers often use flowcharts to diagram their ideas.
Similar flowchart examples
Product development flowchart
A/B testing flowchart
R&D process flowchart
Student grades flowchart
Patient transfer in hospital flowchart
Credit card payment process flowchart
Alarm clock flowchart
- Software Design
- Business Design
- Customer Journey Map
- Engineering
- Organizational
- Brainstorming
- Data Visualization
- Project Management
- Quality Mgmt.
- Analysis Canvas
- Decision Analysis
Problem Solving
Interrelationship Diagram
Driver Diagram
How How Diagram
Why Why Diagram
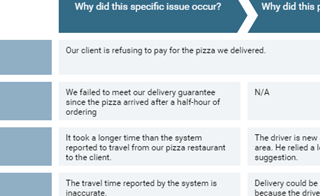
Root Cause Analysis
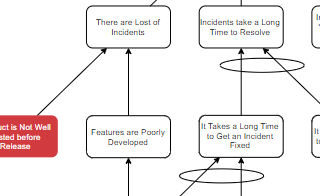
Current Reality Tree
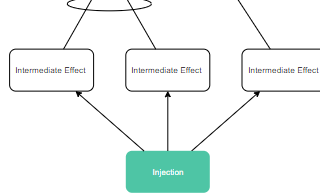
Future Reality Tree
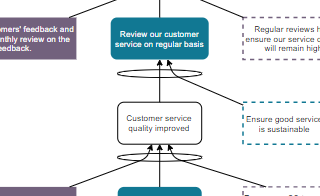
Transition Tree
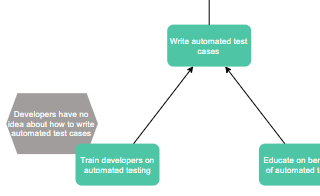
Prerequisite Tree
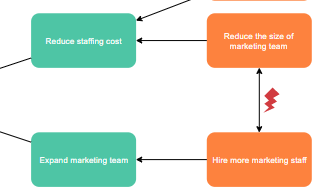
Evaporating Cloud
©2024 by Visual Paradigm. All rights reserved.
- Terms of Service
- Privacy Policy
- Security Overview
EdrawMax Free App
3-step diagramming on the phone
Free Editable Problem and Solution Graphic Organizer Examples
Problem and solution diagrams are useful tools that can be used in order to describe an issue or problem along with proposed steps for its elimination as well as a final solution at the end. If you are looking to understand more about problem and solution graphic organizers , keep on reading till the end. In this post, we are going to touch up some base concepts about these organizers while explaining some examples along the way.
1. What is a Problem and Solution Graphic Organizer
In summation, a problem and solution graphic organizer is defined as a graphical representation of a problem-solving process. The diagram involves writing the essence of the problem in the beginning, then suggesting steps for resolving it, and finally coming up with a solution. By using these diagrams, it becomes easy for a person or team to organize the relevant information into an easily perusable and understandable form.
The reason why problem and solution diagrams are so important is that they are easy to read and present. Should an organization face a problem or issue, the relevant team or department can come up with a simple and straightforward graphic organizer that depicts the best route forward while enumerating the steps necessary for taking that certain route.
If there is any modification that needs to be made with a certain aspect of the solution, it can be easily done so since every step will be separately and clearly mentioned.
2. The Problem and Solution Graphic Organizer Examples
Problem and solutions graphic organizers are used for depicting the steps needed for reconciliation when a certain problem arises. If two or more parties are involved in the resolution of any issue, it is important for them to be on the same level of understanding. Similarly, if there is a large organization and there are a lot of people who need to take part in solving the problem, it is essential that each one of them knows and understands what the issue is, what the steps are that are needed for the resolution and what the final solution will be. By using a problem and solution graphic organizer , you can delegate that knowledge and teach a large number of people the protocol that needs to be followed when solving a problem. The graphic organizer can be presented at a meeting or it can be individually given to each of the involved personnel.
Here are some examples of problem and solution diagrams:
Example 1: Problem and Solution Graphic Organizer
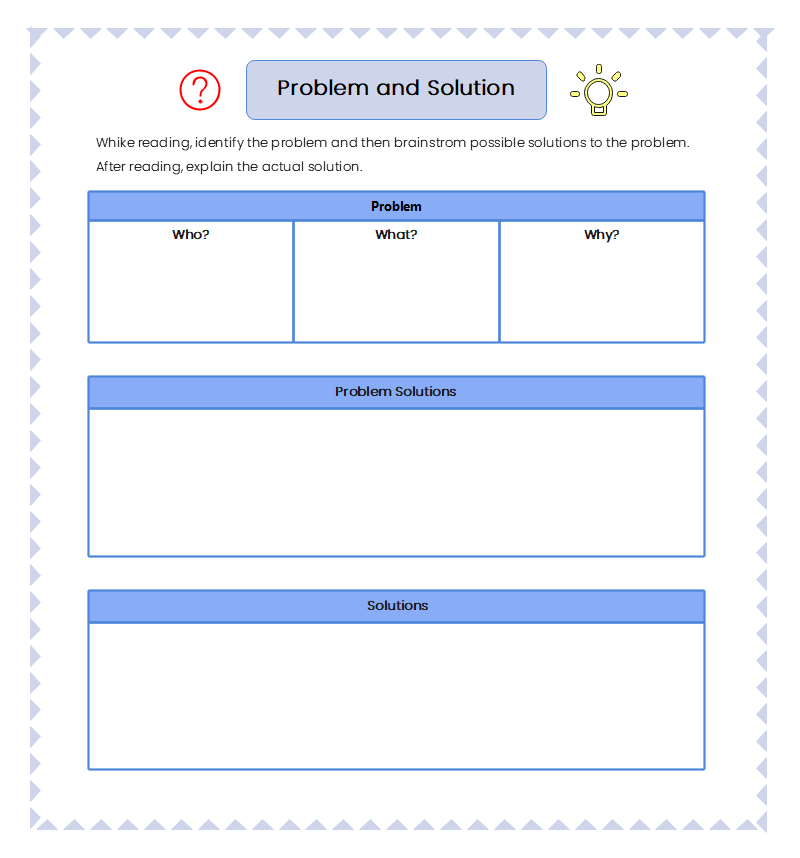
This graphic organizer depicts a simple problem and solution layout. In this example, the problem is shown at the top of the page and it is divided into three sections viz. ‘Who?’, ‘What?’ and ‘Why?’
The benefit of this segregation is that it not only helps the user to define the problem, but it also enables them to describe who the problem pertains to, what the problem actually is and why the problem surfaced. The simple method would be to mention the problem all in one go but dividing them like this gives greater clarity into the matter.
Then comes the ‘Possible Solutions’ section. This is where all possible solutions to the problem are discussed and brainstorming is done. After that, the selected/most suitable solution is delineated in the last section.
Example 2: Weekly Problem and Solution Graphic Organizer
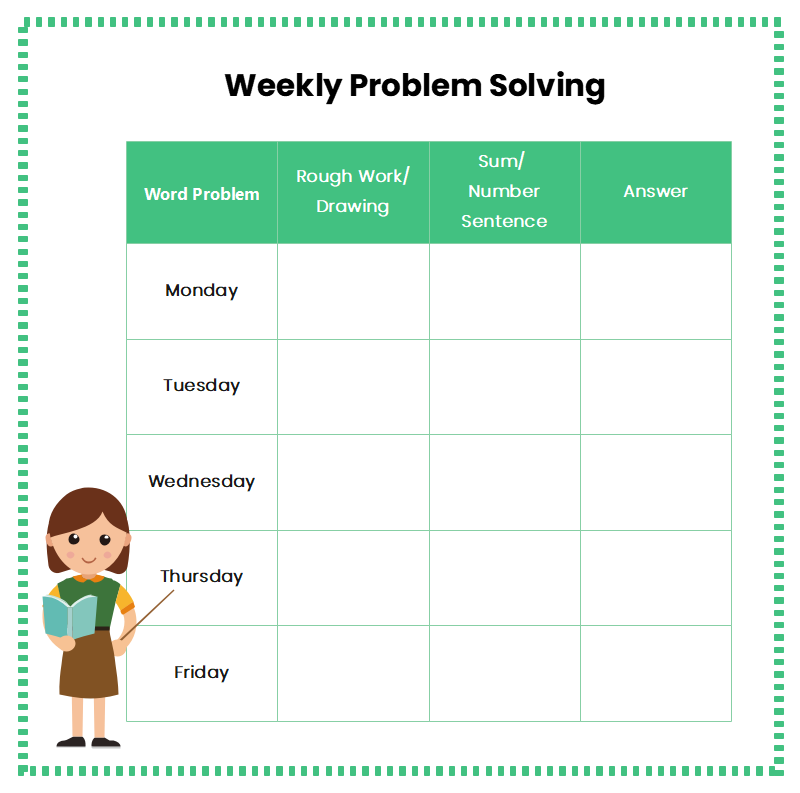
In this example, the layout is a little different. This organizer depicts a problem-solving sheet for five days of a week viz. from Monday to Friday. Each day has three columns in front of it which are for "Rough Work/Drawing", "Sum/Number Sentence" and "Answer" respectively. Instead of focusing on a problem and giving a solution to it (as was the case in the previous example), this organizer features a set of columns and rows designed for students to help with their weekly problem-solving. This is namely an activity sheet for kids rather than an actual problem-solving diagram that can be officially used etc. This template can be useful to accomplish something similar to what it is made for i.e. learning and teaching, but it is not suitable for using to depict a certain problem and its solution.
Example 3: Problem & Solution Graphic Organizer
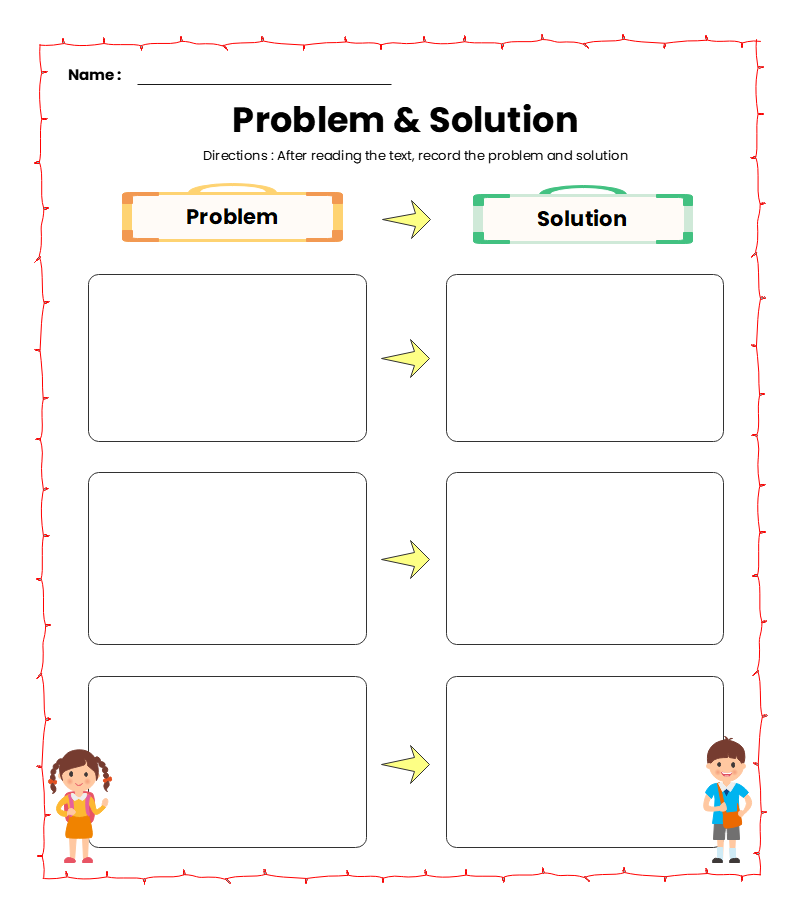
The Problem & Solution Graphic Organizer features a simple problem-solving structure. In this diagram, three boxes on the left are made for the problems while three boxes adjacent to them are for their respective solutions. This design does not have the sequence where the problem first appears followed by the steps of resolution and then the solution. Here, three problems are simultaneously listed with their solutions written directly beside them without any ‘Possible Solutions’ section or steps for resolution.
This sort of graphic organizer can be useful in circumstances where a multitude of problems have arisen at the same time and need to be dealt with swiftly. In such an instance, listing possible alternatives or steps can be arduous, and simply writing the solutions can be much easier.
Example 4: Problem Solution Graphic Organizer
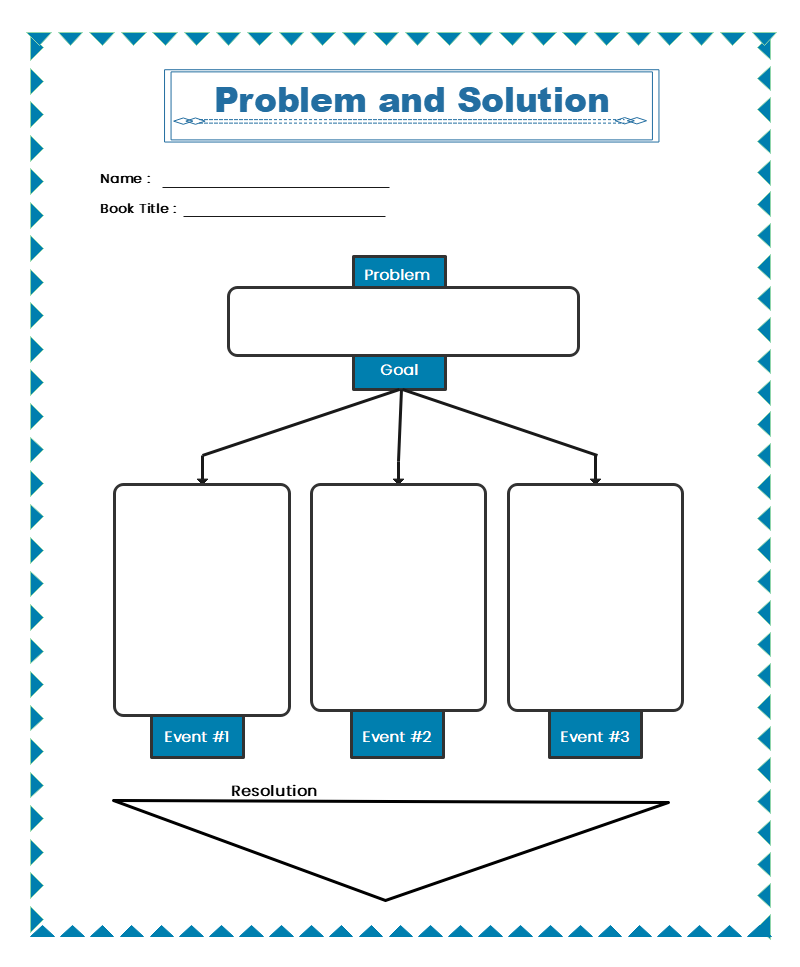
This example features an unusual layout that can be used for problem-solving. Instead of listing the problem, the steps/possible solutions, and then lastly the solution, this example first mentions the problem and then three 'Goals' in the form of 'Event # 1, 2, and 3'. In the 'Event' spaces, you can put in the outcomes you require or the situations you need to find yourself in after resolving the problem. Hence, you would be enumerating the goals you need to achieve by solving the problem.
After the ‘Goals’, the ‘Resolution’ section is given. In this section, one could write the actual steps or procedure that needs to be followed to meet the above ‘Goals’. This template can be more suitable for intricate issues rather than simple problems that require a one-line solution.
Example 5: Problem and Solution Graphic Organizer Example
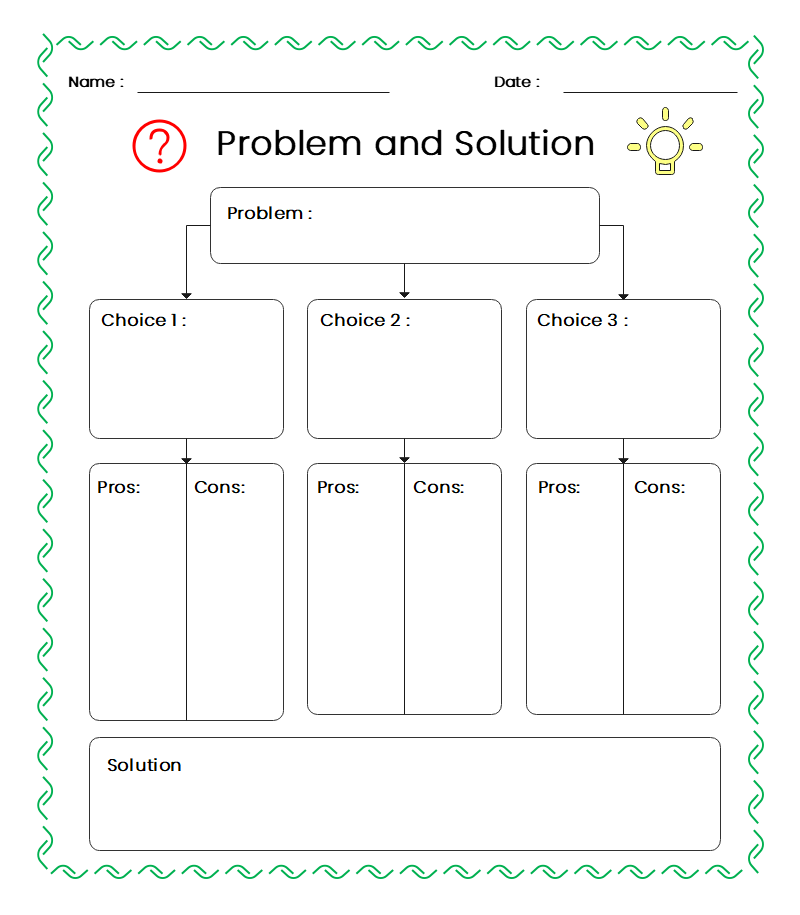
In this example, a very practical and useful approach is used. As we saw before, enumeration of possible solutions is useful for brainstorming and selecting the best one of the lot. This example makes it really easy and simple to compare alternative solutions. It first depicts the problem at the start of the page. Then, three choices are listed underneath the problem. For each choice, a ‘Pros/Cons’ list is given. Finally, in the end, there is a 'Solution' section where you can write the choice you selected and why it is the best one.
By listing the pros and cons of each choice, it can be established which route or plan of action is the most suited and beneficial. The choice which has the most pros and least number of cons can be easily selected.
Example 6: Problem and Solution Graphic Organizer PDF
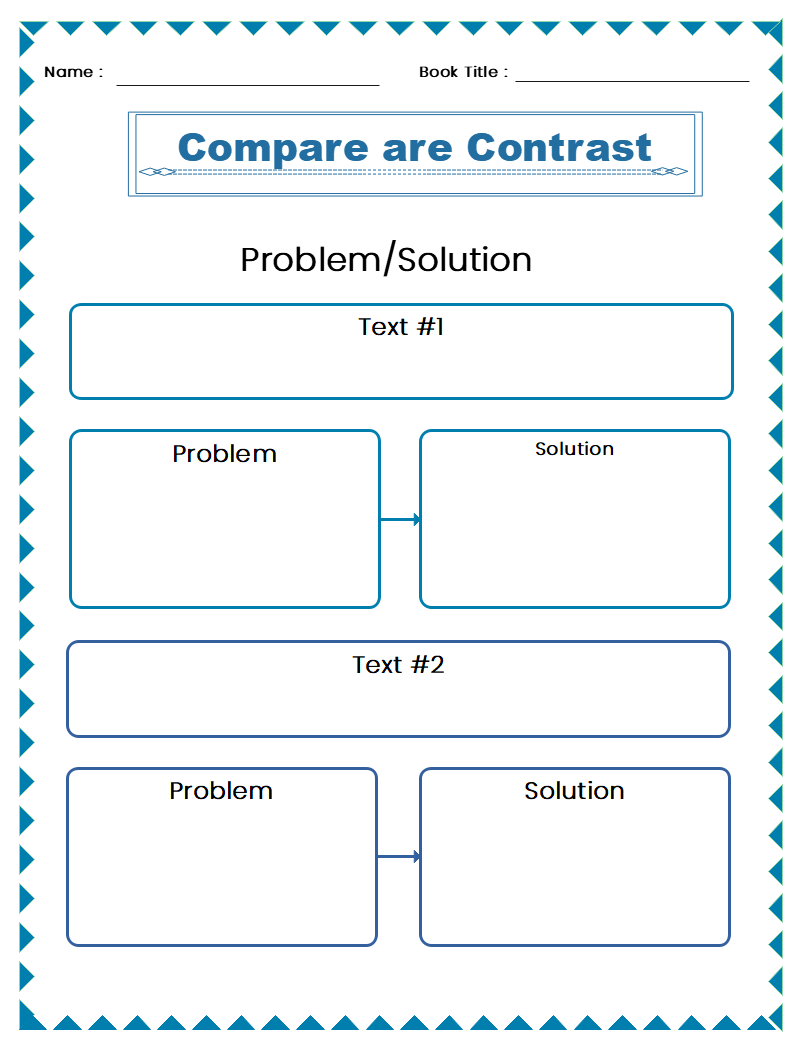
This graphic organizer is labeled 'Compare and Contrast'. In this example, there are two different sets of problems and solutions. Each set starts off with the 'Text', succeeded by the 'Problem' and then the solution.
In each of the sets, the problem can be described along with the suggested solution. Being two, these problems and solutions can be compared with each other. This sort of graphic organizer can be suitable for specific situations which involve the comparison and matching of more than one problem/solution. This template can also be used to match the alternate solutions to a single problem but the problem part in both sections would have to be identical.
Example 7: Problem and Solution Worksheets
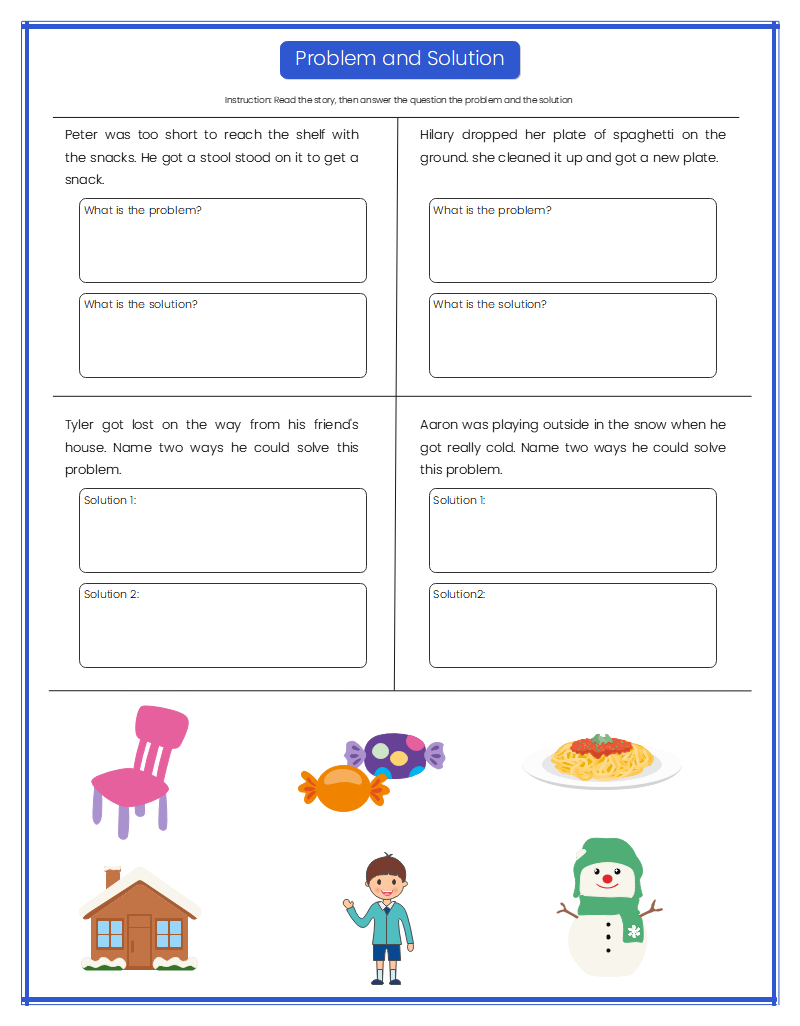
The next example on our list is the Problem and Solution Worksheet. The worksheet is an activity for students and is not exactly a template that can be used freely for any other situation, circumstance, or problem. In this worksheet, there are four sections, each of which contains a certain scenario. In each section, the problem is required and then the solution.
This activity is beneficial for teaching children about problem and solution organizers and the basics of problem-solving. Although the scenario in each section has been explicitly mentioned, it is still required of the students to point out which part is the problem and which part is the solution. This improves their identification skills.
Example 8: Problem and Solution Reading Comprehension Worksheet
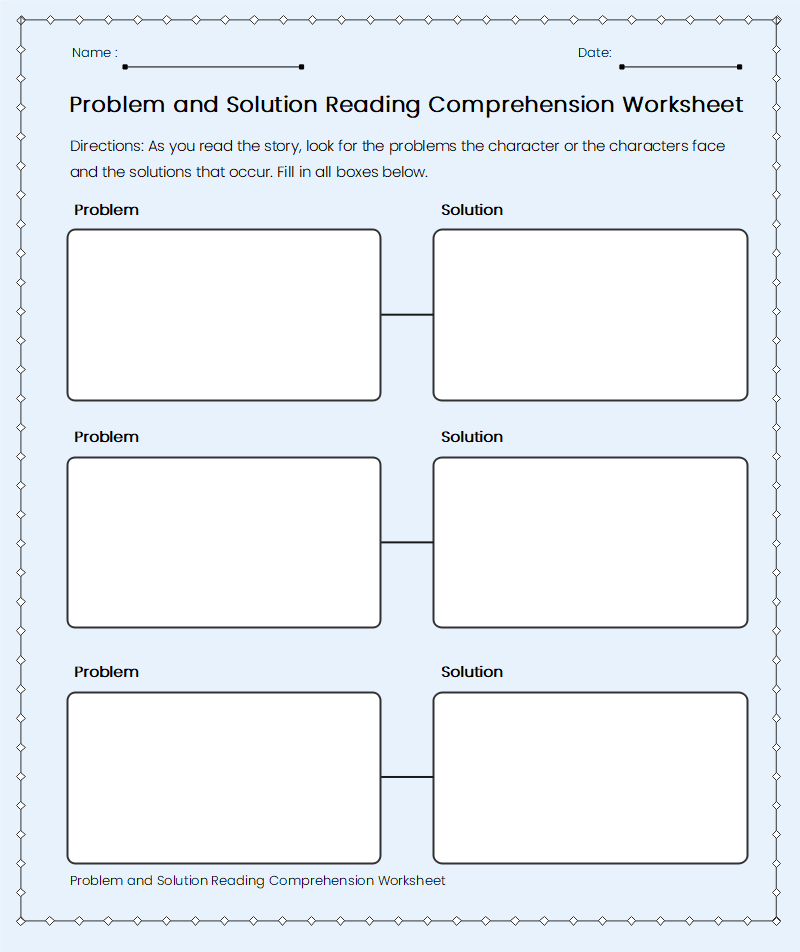
This worksheet is also a suitable example to include in this list. The purpose of this worksheet is to tell students to find problems or issues in the story’s character and to list those issues along with their possible solutions.
Albeit with specific instruction, this worksheet also falls in the category of problem and solution graphic organizers. There are three different problems that need to be identified. Three solutions need to be given for each respective problem.
This example has a simple layout unlike some of the more complicated ones we have seen on this list. The worksheet simply requires the students to point out the problem and to suggest a solution. No alternatives are explored, nor are any pros and cons mentioned.
Example 9: Story Elements - Problem and Solution worksheet
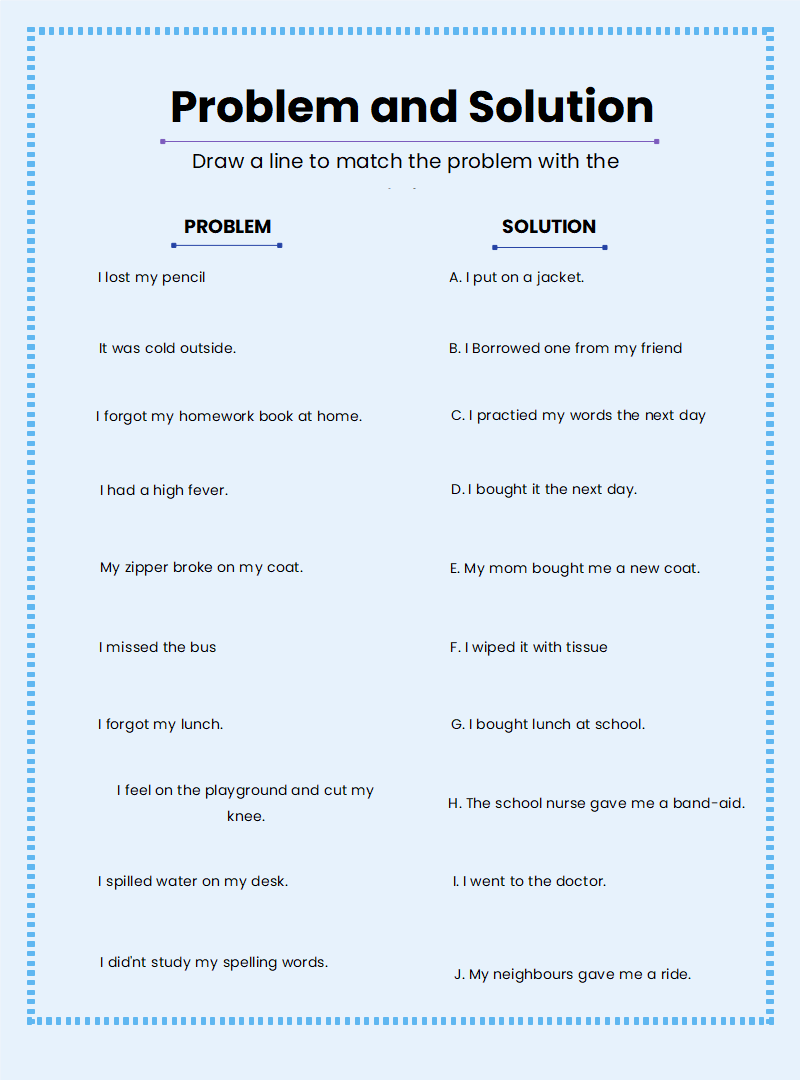
This worksheet does not fall in the strict category of graphic organizers. This is a class activity that requires the student to match the problems to suitable solutions. In this example, the problems are given on the left hand and the solutions are given on the right. The solutions and problems are written all jumbled up and are not written adjacent to one another.
This sort of worksheet can be a useful tool in teaching kids the concept behind problem-solving. This example can be a stepping stone using which the students can, later on, realize how they have to present a solution to any problem that they face.
3. Online Problem and Solution Graphic Organizer Maker
Now that we have some idea of what these organizers are, let’s get to the part where we actually make one. If you are looking to make an organizer similar to the examples we saw above, simply head over to EdrawMax Online . At EdrawMax Online, there is a large variety of charts, drawings, and diagrams that you can make. The software is totally online, and it has a user-friendly interface. Shapes can be added from the library by simply dragging them over to the desired spot on the canvas. If you don’t want to make a layout from scratch, you can go to the template gallery and pick a pre-made organizer to edit as your own.
4. Key Takeaways
Problem and Solution Graphic Organizers are great tools that you can use for problem-solving. By mentioning the problem at hand, the steps needed for its resolution, and the selected solution, you can come up with a clear and concise representation of a problem-solving process. EdrawMax Online is your go-to place for making diagrams, drawings, and graphic organizers. The software is cloud-based and offline use available, free, and easy to use and it can convert your file into your desired format. You can find out more graphic organizer examples in the Template Gallery.
Related Articles


Ishikawa Fishbone Diagrams: A Proven Method for Problem-Solving
- October 25, 2024
- Lean Basics
Ishikawa fishbone diagrams, also known as cause-and-effect diagrams or fishbone charts, are powerful tools for problem-solving and quality management. Developed by Kaoru Ishikawa in the 1960s, these diagrams help teams identify, organize, and analyze potential causes of problems in various processes. Whether in manufacturing, healthcare, or service industries, fishbone diagrams facilitate root cause analysis, making them essential for continuous improvement initiatives.
What is a Fishbone Diagram?
Step 1: define the problem, step 2: draw the diagram, step 3: brainstorm causes, step 4: analyze the causes, step 5: develop action plans, best practices for effective fishbone diagrams, 👍 advantages, 👎 disadvantages, tools for creating fishbone diagrams, applications of ishikawa fishbone diagrams, implementation.
The fishbone diagram visually represents the relationship between a problem and its potential causes. Its structure resembles a fish skeleton, where:
- The head represents the main problem or effect.
- The bones branching off from the spine represent categories of causes.
- Smaller branches off the main bones detail specific causes within those categories.
This structured approach enables teams to explore the root causes of issues systematically and collaboratively.

How to Create an Ishikawa Fishbone Diagram
Creating a fishbone diagram is straightforward. Follow these steps to ensure an effective analysis:
Clearly articulate the problem or effect you want to analyze. This statement should be specific and measurable. For example, “Increased customer complaints about product quality” is a clear problem statement.
- Create the backbone : Draw a horizontal line (the spine) and write the problem statement at the head of the fish.
- Manpower: The people involved in the process.
- Method : The process steps involved to produce/deliver the product or service.
- Materials : The raw materials or consumables used to produce/deliver the product or service.
- Mother Nature : Both controllable and uncontrollable environmental conditions in the process area.
- Machine : The equipment used to produce/deliver the product or service.
- Measurement : Physical measurements or inspections involved in the process.

Gather your team and brainstorm potential causes for the problem under each category. Encourage open discussion and ensure that every idea is captured.
After brainstorming, prioritize the causes by their impact and likelihood. Focus on identifying root causes that, if addressed, will significantly reduce or eliminate the problem. The multi-voting technique can be used to narrow down the causes to the most critical ones.
Once the most critical root causes are identified, develop action plans to address them. Assign responsibilities, set deadlines, and establish metrics to evaluate progress.
- Involve the Right People: Ensure that team members with relevant knowledge and experience are involved in the brainstorming process. Diverse perspectives lead to more comprehensive cause identification.
- Keep it Simple: Avoid overcomplicating the diagram. Focus on major categories and key causes to maintain clarity and effectiveness.
- Use Clear Language: When labeling categories and causes, use simple, clear language. This ensures that everyone involved understands the diagram without ambiguity.
- Regularly Review and Update: As processes and circumstances change, revisit the fishbone diagram to ensure its relevance. Regular updates can lead to continual improvement.
Advantages and Disadvantages of Fishbone Diagrams
While the fishbone diagram is definitely a powerful tool for root cause analysis, it also has its drawbacks. Here’s a closer look at both sides.
- Visual Clarity : The fishbone diagram provides a clear visual representation of the relationship between a problem and its potential causes. This visual format helps teams easily identify and understand complex relationships, making it easier to communicate findings to stakeholders.
- Structured Approach : The diagram organizes potential causes into categories, often referred to as the “bones” of the fish. This structured approach encourages comprehensive analysis and ensures that no potential cause is overlooked.
- Facilitates Team Collaboration : Creating a fishbone diagram is typically a group activity, promoting collaboration and brainstorming. Team members can contribute their perspectives, leading to a more thorough investigation of the issue. This collaborative effort fosters a sense of ownership and commitment to solving the problem.
- Encourages Comprehensive Thinking : By breaking down a problem into various categories, the fishbone diagram encourages teams to think critically about all possible factors that could contribute to the issue. This holistic view can reveal root causes that may not have been initially apparent.
- Simplicity and Accessibility : The fishbone diagram is straightforward to create and understand. It does not require advanced training, making it accessible to teams across various levels of expertise. This simplicity helps organizations adopt RCA practices without significant investment in time or resources.
- Versatile Applications : Ishikawa diagrams can be applied in various fields, including manufacturing, healthcare, and service industries. Their versatility makes them a valuable tool for any organization seeking to improve quality and resolve issues.
- Identification of Root Causes vs. Symptoms: Ishikawa diagrams help teams distinguish between symptoms and root causes. By diving deeper into each cause, teams can implement effective solutions rather than just addressing superficial issues.
- Facilitation of Continuous Improvement: Using fishbone diagrams aligns with continuous improvement methodologies like Six Sigma and Lean. They support the identification and elimination of waste , leading to improved processes and outcomes.
- Limited Depth : While the fishbone diagram helps identify potential causes, it may not provide enough depth for complex problems. It can sometimes oversimplify issues, leading teams to overlook underlying factors that require more in-depth analysis.
- Potential for Bias : The collaborative nature of creating a fishbone diagram can lead to groupthink, where dominant voices may overshadow others. This can result in biased conclusions or a focus on familiar causes rather than exploring all possibilities.
- Static Representation : The diagram represents a snapshot of the analysis at a particular point in time. As new information emerges or circumstances change, the diagram may quickly become outdated, necessitating continual revisions.
- Requires Follow-Up : Identifying potential causes is just the first step; the fishbone diagram does not provide solutions. Teams must follow up with further analysis and action plans to address the identified causes, which can sometimes lead to inaction if not properly managed.
- Over-reliance on the Tool : Organizations may become overly reliant on fishbone diagrams as a solution for all problems. This reliance can hinder the exploration of other effective RCA methodologies, limiting the team’s problem-solving toolkit.
- Time-Consuming : Depending on the complexity of the issue and the size of the team, creating a thorough fishbone diagram can be time-consuming. If not managed efficiently, this could detract from other critical tasks or deadlines.
While you can create fishbone diagrams using pen and paper or a whiteboard, various digital tools can streamline the process. Here are some popular options:
- Microsoft Visio : A robust diagramming tool that offers templates for fishbone diagrams.
- Lucidchart : An online diagramming application that allows for collaborative diagram creation.
- Miro : A digital whiteboard that facilitates real-time collaboration and brainstorming.
- Canva : Known for its design capabilities, Canva offers templates for creating visually appealing fishbone diagrams.
Fishbone diagrams are often associated with manufacturing processes, but they can be used in almost every sector of business.
Case Study: Using Fishbone Diagrams in a Manufacturing Environment
A manufacturing company experienced a significant increase in product defects, leading to customer complaints and returns. The management team decided to utilize an Ishikawa fishbone diagram to identify the root causes of the problem.
- Define the Problem : The team articulated the problem as “Increase in product defects exceeding 5%.”
- Draw the Diagram : They categorized potential causes into people, processes, materials, machinery, and environment.
- Manpower : Insufficient training, high turnover rates.
- Method : Lack of standardized procedures, inconsistent quality checks.
- Materials : Subpar raw materials, supply chain issues.
- Machine : Aging equipment, lack of maintenance.
- Measurement: Gage R&R shows measurement method is not repeatable, test equipment out of calibration.
- Mother Nature : Poor working conditions affecting morale, high humidity affecting product quality.
- Analysis and Action Plan : After prioritizing the causes, the team focused on training programs for employees and implementing standardized quality checks. They also established a maintenance schedule for machinery.

Within three months, the company saw a 50% reduction in product defects. The structured analysis facilitated by the fishbone diagram enabled the team to implement effective solutions quickly.
Ishikawa fishbone diagrams are invaluable tools for problem-solving and quality management across various industries. Their structured approach to identifying root causes fosters collaboration, enhances analysis, and supports continuous improvement initiatives. By following best practices and leveraging digital tools, organizations can effectively utilize fishbone diagrams to drive meaningful change and improve processes.
Incorporating fishbone diagrams into your problem-solving toolkit can lead to significant enhancements in quality, efficiency, and customer satisfaction. Whether you’re in manufacturing, healthcare, or service industries, the power of the fishbone diagram can help you tackle challenges effectively and sustainably.
Lindsay Jordan
Hi there! My name is Lindsay Jordan, and I am an ASQ-certified Six Sigma Black Belt and a full-time Chemical Process Engineering Manager. That means I work with the principles of Lean methodology everyday. My goal is to help you develop the skills to use Lean methodology to improve every aspect of your daily life both in your career and at home!
Leave a Reply Cancel Reply
Your email address will not be published. Required fields are marked *
Name *
Email *
Add Comment *
Save my name, email, and website in this browser for the next time I comment.
I accept the Privacy Policy
Post Comment
This site uses Akismet to reduce spam. Learn how your comment data is processed .
Trending now


IMAGES
VIDEO